The International Tanker Owners Pollution Federation (ITOPF) issued its oil spill statistics, noting a continuing decrease at the frequency of oil spills from tankers. With one large and two medium oil spills in 2019, the number in 2019 was the lowest in 50 years, ITOPF notes.
ITOPF maintains a database of oil spills from tank vessels, including combined carriers, FPSOs and barges.
Key statistics
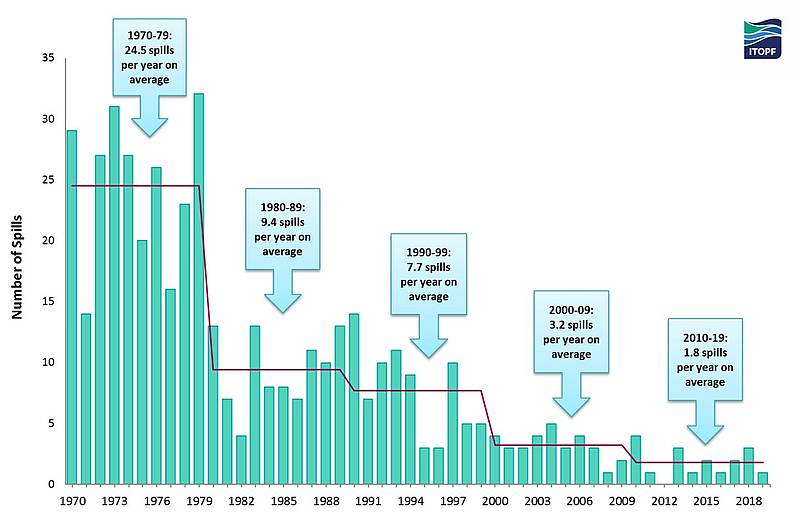
- The average number of spills of 7 tonnes or more in the 1970s was about 79 per year and has now decreased by over 90% to a low of six.
- Similarly, there has been a significant reduction in the quantity of oil spilled through the decades. The total amount spilled per decade has reduced by about 95% since the 1970s.
- In 2019, one large spill (>700 tonnes) and two medium spills (7–700 tonnes) were reported.
- Three spills, of size 7 tonnes or more, is the lowest recorded for any particular year in the last five decades.
- The estimated total amount of oil lost to the environment through tanker incidents in 2019 was approximately 1,000 tonnes.
Number of oil spills in 2019
- For 2019, ITOPF recorded one large spill (>700 tonnes) and two medium spills (7–700 tonnes).
- The large spill occurred in North America in May and resulted from a vessel collision.
- Both medium spills occurred in South Asia, one resulted from a collision and the other vessel partially sank in unknown circumstances.
- Three spills, of size 7 tonnes or more, is the lowest recorded for any particular year in the last five decades.
- The widely reported oil spill that has contaminated approximately 3,000 km of coastline in eleven states in Brazil is still a mystery and could change this year’s statistics if confirmed as a tanker spill.
Quantity of oil spilt in 2019
The total volume of oil lost to the environment recorded in 2019 was approximately 1,000 tonnes; the same quantity recorded in 2012 and the lowest annual figure recorded in the last five decades.
Global oil spill trend
Over the last 50 years, trends identified for marine oil spills from tankers have been exceptionally positive, showing marked downward movement over the decades.
-Tanker spills from 1970 to 2019

- The number of large spills (>700 tonnes) has decreased significantly over the last few decades and since 2010 averages 1.8 per year.
- Similarly, there has been a significant decrease in the quantity of oil spilled through the decades.
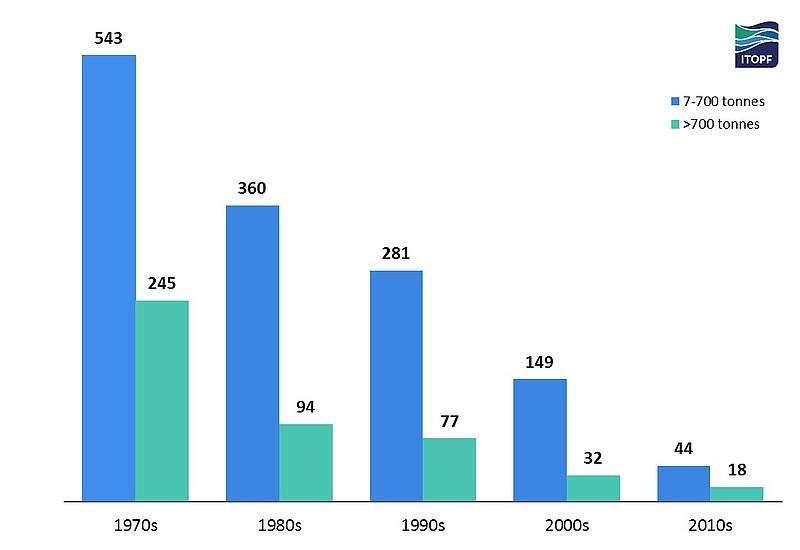
- In the 2010s approximately 164,000 tonnes of oil were lost from tanker spills of 7 tonnes and above, a 95% reduction since the 1970s.
It is interesting to note that the progressive reduction in the number of large spills is significant when data is analysed per decade rather than annually.
Data recorded from 1970 to 2019 illustrate fluctuations in the yearly values within a decade.
A continuation of long-term decline can also be seen with medium sized spills (7–700 tonnes).
The average number of spills per year this decade is 4.4, which is below a tenth of the average recorded in the 1970s.
While increased tanker movements might imply increased risk, it is encouraging to observe that the downward trend in oil spills continues despite an overall increase in oil trading over the period.
-Large oil spills
When looking at the frequency and quantities of oil spilt, it should be noted that a few very large spills are responsible for a high percentage of the oil spilt. For example, in more recent decades the following can be seen:
- In the 1990s there were 358 spills of 7 tonnes and over, resulting in 1,134,000 tonnes of oil lost; 73% of this amount was spilt in just 10 incidents.
- In the 2000s there were 181 spills of 7 tonnes and over, resulting in 196,000 tonnes of oil lost; 75% of this amount was spilt in just 10 incidents.
- This decade, there have been 62 spills of 7 tonnes and over, resulting in 164,000 tonnes of oil lost; 91% of this amount was spilt in just 10 incidents. One incident is responsible for about 70% of the quantity of oil spilt this decade.
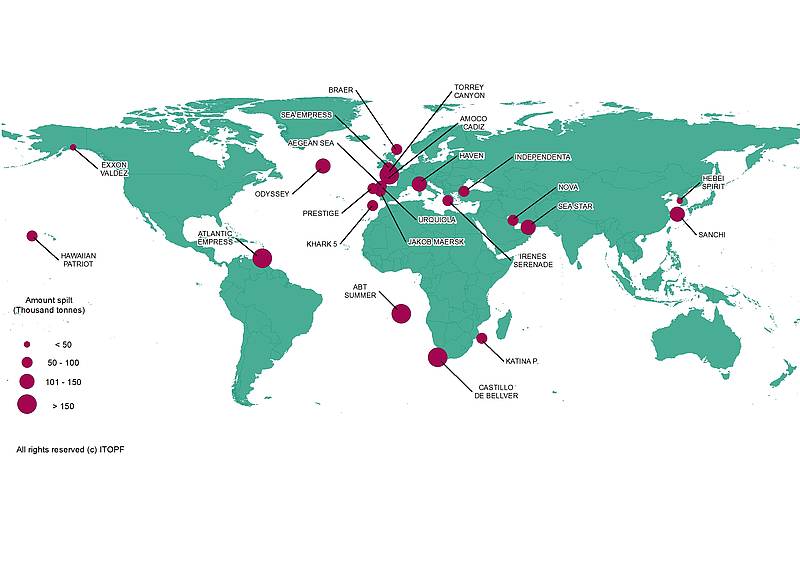
- In terms of the volume of oil spilt, the figures for a particular year may be severely distorted by a single large incident. This is clearly illustrated by incidents such as ATLANTIC EMPRESS (1979), 287,000 tonnes spilt; CASTILLO DE BELLVER (1983), 252,000 tonnes spilt; ABT SUMMER (1991), 260,000 tonnes spilt and SANCHI (2018), 113,000 tonnes spilt.
Causes of large oil spills
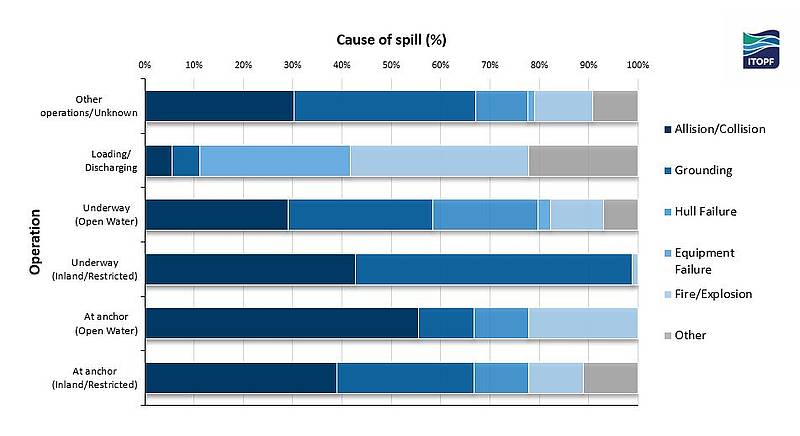
- In the period 1970 to 2019, 50% of large spills occurred while the vessels were underway in open water; allisions, collisions and groundings account for 58% of the causes of these spills.
- These same causes account for an even higher percentage of spills (99%) when the vessels were underway in inland or restricted waters.
- Incidence of spills >700 tonnes by operation at time of incident and primary cause of spill, 1970 -2019
Top 20 Major Spills
- ATLANTIC EMPRESS – 1979
- ABT SUMMER – 1991
- CASTILLO DE BELLVER – 1983
- AMOCO CADIZ – 1978
- HAVEN – 1991
- ODYSSEY – 1988
- TORREY CANYON – 1967
- SEA STAR – 1972
- SANCHI – 2018
- IRENES SERENADE – 1980
- URQUIOLA – 1976
- HAWAIIAN PATRIOT – 1977
- INDEPENDENTA – 1979
- JAKOB MAERSK – 1975
- BRAER – 1993
- AEGEAN SEA – 1992
- SEA EMPRESS – 1996
- KHARK 5 – 1989
- NOVA – 1985
- KATINA P – 1992
- PRESTIGE – 2002
- EXXON VALDEZ – 1989
- HEBEI SPIRIT – 2007




These incredible results illustrate how efficient the petrochemical major charterers vessel inspection programs (SIRE & CDI) have been over the past 30+ years introducing Vetting systems which imposed commercial sanctions for those that did not conform. Their introduction in the late 1980’s/early 1990’s was driven by the alarming record of serious pollutions over the previous two decades. At the same time these two programs have provided the incentive for tanker operators to improve their overall safety performance.
Indeed the strict inspection protocols are gaining grounds. The tanker business is lucrative and as long as the tanker owners are following the rules and regulations the oceans will free of oil pollution and safe havens for marine species.