


Paris MoU has published its Annual Report on Port State Controls which contains details of the main developments in the Paris MoU for the year and the outcomes of their inspections.
2015 shows a large decrease in the refusal of access (“bans”) within the region: 11 bans compared to 20 in 2014. The detention percentage has remained stable at 3.33%. The number of deficiencies has decreased 10% related to 2014. The number of inspections carried out was 17,858, slightly less than 2014.
Annual Report Summary
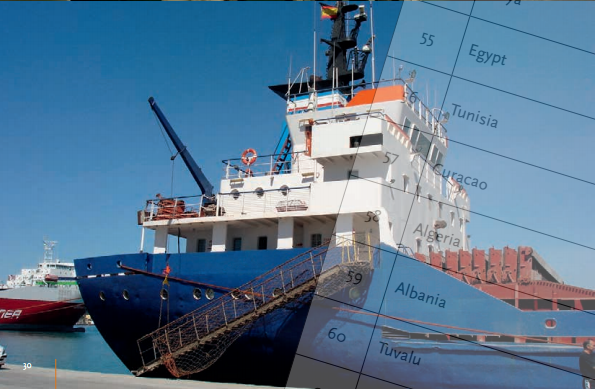
Regarding banning, most cases involved ships which have been banned for multiple detentions (45). 5 ships have been banned a second time. A number (12) were banned for failing to call at an indicated repair yard. The remaining 3 cases involved ships which “jumped the detention”, by sailing without authorization. Over a 3 year period the flags of the United Republic of Tanzania, the Republic of Moldova, Saint Vincent and the Grenadines and Togo have recorded the highest number of bannings. Looking at the Paris MoU “White, Grey and Black Lists” the overall situation regarding the quality of shipping seems to be stabilizing. Although individual flag states have changed lists, the total amount of 43 flag states on the “White list” equals 2014.
Sweden is leading this year’s list, followed by the United Kingdom and France. Belgium has made a move upwards on the “White List”. The United States of America has made a move downwards.
This year Portugal and Spain have moved from the “Grey List” to the “White List”. India and Switzerland moved from the “White List” to the “Grey List”. Saint Kitts and Nevis moved from the “Grey List” to the “Black List”. As 2014, in 2015 there are again 11 flags on the “Black List”, with the United Republic of Tanzania having the worst performance again. Recognized Organizations (ROs) are delegated by flag States to carry out statutory surveys on their behalf. For this very reason, it is important to monitor their performance. The best performing RO over the period 2013-2015 was DNV GL, followed by Det Norske Veritas (DNV) and American Bureau of Shipping (ABS).
International Register of Shipping is bottom of the list in 2015, in terms of poor performance, followed by Universal Shipping Bureau Inc and Bulgarian Register of Shipping. For several years a joint submission with the Tokyo MoU to IMO has addressed the correlation between flags and ROs working on their behalf. The results are published in the Annual Report as well. Useful information for the industry that would like to stay clear of the risk of sub standard shipping.
After an increase of the total number of inspections in 2014, the number has slightly decreased. Since 2011 (the start of the NIR) the average detention percentage had slightly increased annually until 2013 (3.78%), after which a significant decrease has been recorded for 2014 (3.32%). 2015 is at the same level, 3.33%. Spain, Italy, the Netherlands, France, Germany, Greece and the United Kingdom contributed most to the overall inspection efforts in terms of percentage, together over 51%. High Risk Ships have been operating mostly in the southern part of the region, while Low Risk Ships have been calling in the north western part of the region. With 1,166 inspections and 131 detentions the ships flying a “black listed flag“ score a detention rate of 11.23%, which is similar to 2014 and 2013. For ships flying a “grey listed flag” the detention rate is 8.58%, which is significantly higher than 2014 (6.27%). For ships flying a “white listed flag” the detention rate is 2.50% which is at the same level as 2014.
The 5 most frequently recorded deficiencies in 2015 were “ISM” (4.3%, #1797), “fire doors/openings in fireresisting divisions” (2.5%, #1044), “nautical publication” (2.5%, #1016), “charts” (2.4%, #996) and “oil record book” (1.6%, #645).

Basic Port State Control Figures 2015

Facts & Figures 2015
Inspections
With a total number of 17,858 inspections performed in 2015 the inspection figures show a decrease of 3.1% compared with the figures of 2014. Each individual ship was inspected an average of 1.17 times per year, a rate which is slightly lower to that of 2014. After a drop in the number of inspections that started with the introduction of the New Inspection Regime in January 2011, and continued in 2012 and 2013, the 2014 figures showed an increase of 4%. 2015 shows a decrease of 3.1% again.
Deficiencies
In 2013 the number of deficiencies recorded was 49,074. In 2014 the number of deficiencies was 45,979. In 2015 the number of deficiencies decreased significantly to 41,436. During 53% of all inspections performed, one or more deficiencies were recorded. In 2014 this figure was 55%. The average number of deficiencies per inspection also decreased from 2.5 in 2014 to 2.3 in 2015.
Detentions
Some deficiencies are clearly hazardous to safety, health or the environment and the ship is detained until they are rectified. Detention rates are expressed as a percentage of the number of inspections, rather than the number of individual ships inspected to take account of the fact that some ships are detained more than once a year.
Compared with 2014, the number of detentions has decreased from 612 to 595 detentions. The average detention rate in 2015 is 3.33%. In 2014 the detention rate was 3.32%. In 2013 the detention rate was 3.78%. The detention rate has stabilized this year. “White, Grey and Black List” The “White, Grey and Black (WGB) List” presents the full spectrum, from quality flags to flags with a poor performance that are considered high or very high risk. It is based on the total number of inspections and detentions over a 3-year rolling period for flags with at least 30 inspections in the period.

Fire safety
In 2015 deficiencies in fire safety accounted for 13.4% of all deficiencies recorded (equal to 2014). Although relatively the same percentage regarding the total of deficiencies, the number of deficiencies decreased from 6176 (in 2014) to 5558 (in 2015).
Pollution prevention
Deficiencies in MARPOL Annex I show a decrease of 9% in 2015 (795), compared with 2014 (874). Deficiencies in MARPOL Annex IV show a slight decrease of 1% 2015 (338), compared with 2014 (344). Deficiencies in MARPOL Annex V show an increase of 2% 2015 (609), compared with 2014 (596). Deficiencies in MARPOL Annex VI show an increase of 2% in 2015 (470), compared with 2014 (458). The relative part regarding the total deficiencies remains similar at 5.4%.
Working and living conditions
On 20 August 2013 the Maritime Labour Convention 2006 entered into force. In 2015, as expected, the number of ILO 147 deficiencies has decreased for the second year, while the number of MLC deficiencies has increased. Most deficiencies have been found in the following areas:
- Health and safety and accident prevention (area 11) 2,656 (41% of all MLC deficiencies),
- food andcatering (area 10) 1,058 (17%),
- hours of work and rest (area 6) 730 (12%),
- accommodation (area 8) 583 (9%) and
- seafarer’s employment agreements (area 4) 395 (6%) deficiencies.
The percentage of deficiencies regarding working and living conditions, related to the total of deficiencies is 14.9%.
Management
The number of ISM related deficiencies was similar in 2015 (1797) to 2014 (1801). The percentage regarding the total deficiencies increased, however, from 3.9% to 4.3%
Further information may be found in the report below

Source & Image credits: Paris MoU