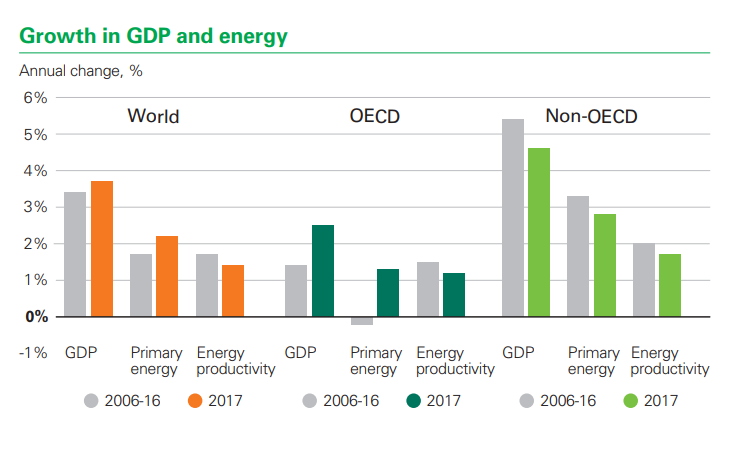
Global primary energy consumption grew strongly in 2017, led by natural gas and renewables, with coal’s share of the energy mix continuing to decline. The vast majority of the increase in global energy consumption came from the developing world, accounting for nearly 80% of the expansion, according to a new statistical review of world energy for 2017 by BP.
China alone contributed over a third of that growth, with energy consumption growing by over 3% in 2017, almost three times the rate seen
over the past couple of years, according to Spenser Dale, BP Group Chief Economist. Despite this increase, the growth of China’s energy demand in 2017 was still significantly slower than its 10-year average, and its rate of decline in energy intensity was more than twice the global average. Two steps forward, one step back.
The step back was coal (1.0%, 25 Mtoe), which grew for the first time since 2013. This was largely driven by India, but it’s also notable that Chinese coal consumption increased after three years of successive falls.
Energy developments
- Primary energy consumption growth averaged 2.2% in 2017, up from 1.2 % last year and the fastest since 2013. This compares with the 10-year average of 1.7% per year.
- By fuel, natural gas accounted for the largest increment in energy consumption, followed by renewables and then oil.
- Energy consumption rose by 3.1% in China. China was the largest growth market for energy for the 17th consecutive year.

Carbon emissions
- Carbon emissions increased by 1.6%, after little or no growth for the three years from 2014 to 2016.
Oil
- The oil price (Dated Brent) averaged $54.19 per barrel, up from $43.73/barrel in 2016. This was the first annual increase since 2012.
- Global oil consumption growth averaged 1.8%, or 1.7 million barrels per day (b/d), above its 10-year average of 1.2% for the third consecutive year. China (500,000 b/d) and the US (190,000 b/d) were the single largest contributors to growth.
- Global oil production rose by 0.6 million b/d, below average for the second consecutive year. US (690,000 b/d) and Libya (440,000 b/d) posted the largest increases in output, while Saudi Arabia (-450,000 b/d) and Venezuela (-280,000 b/d) saw the largest declines.
- Refinery throughput rose by an above-average 1.6 million b/d, while refining capacity growth was only 0.6 million b/d, below average for the third consecutive year. As a result, refinery utilisation climbed to its highest level in nine years.
Natural gas
- Natural gas consumption rose by 96 billion cubic metres (bcm), or 3%, the fastest since 2010.
- Consumption growth was driven by China (31 bcm), the Middle East (28 bcm) and Europe (26 bcm). Consumption in the US fell by 1.2%, or 11 bcm.
- Global natural gas production increased by 131 bcm, or 4%, almost double the 10-year average growth rate. Russian growth was the largest at 46 bcm, followed by Iran (21 bcm).
- Gas trade expanded by 63 bcm, or 6.2%, with growth in LNG outpacing growth in pipeline trade.
- The increase in gas exports was driven largely by Australian and US LNG (up by 17 and 13 bcm respectively), and Russian pipeline exports (15 bcm).
Coal
- Coal consumption increased by 25 million tonnes of oil equivalent (mtoe), or 1%, the first growth since 2013.
- Consumption growth was driven largely by India (18 mtoe), with China consumption also up slightly (4 Mtoe) following three successive annual declines during 2014-2016. OECD demand fell for the fourth year in a row (-4 mtoe).
- Coal’s share in primary energy fell to 27.6%, the lowest since 2004.
- World coal production grew by 105 mtoe or 3.2%, the fastest rate of growth since 2011. Production rose by 56 mtoe in China and 23 mtoe in the US.
Renewables, hydro and nuclear energy
- Renewable power grew by 17%, higher than the 10-year average and the largest increment on record (69 mtoe).
- Wind provided more than half of renewables growth, while solar contributed more than a third despite accounting for just 21% of the total.
- In China, renewable power generation rose by 25 mtoe – a country record, and the second largest contribution to global primary energy growth from any single fuel and country, behind natural gas in China.
- Hydroelectric power rose by just 0.9%, compared with the 10-year average of 2.9%. China’s growth was the slowest since 2011, while European output declined by 10.5% (-16 mtoe).
- Global nuclear generation grew by 1.1%. Growth in China (8 mtoe) and Japan (3 mtoe) was partially offset by declines in South Korea (-3 mtoe) and Taiwan (-2 mtoe).
Power generation
- Power generation rose by 2.8%, close to the 10-year average. Practically all growth came from emerging economies (94%). Generation in the OECD has remained relatively flat since 2010.
- Renewables accounted for almost half of the growth in power generation (49%), with most of the remainder provided for by coal (44%).
- The share of renewables in global power generation increased from 7.4% to 8.4%.
Key materials
- Cobalt production has grown by only 0.9% p.a. since 2010, while lithium production has increased by 6.8% p.a. over the same period.
- Cobalt prices more than doubled in 2017, while lithium carbonate prices increased by 37%.
Explore more herebelow:


