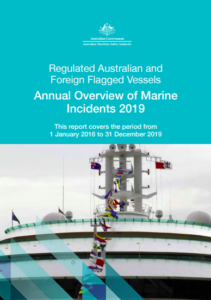
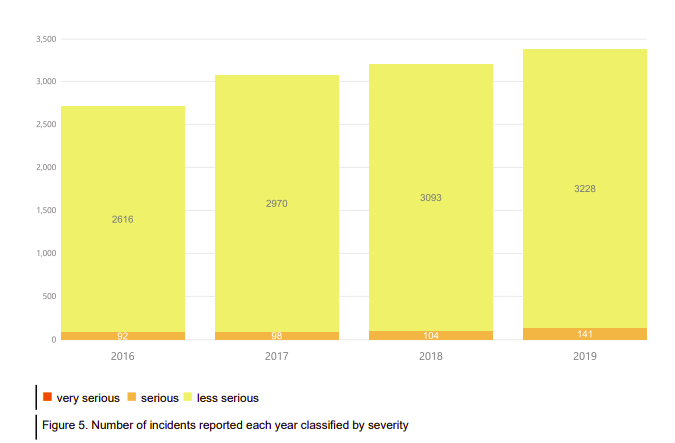
AMSA received a total of 12,349 marine incident reports in 2016-2019, according to the first marine incident annual report for regulated Australian and foreign flagged commercial vessels in Australian waters. The data suggests a significant upward trend in serious incidents between 2018-2019, unveiling the need for a concerted effort on improving safety.
The 2019 annual report presents an analysis of marine incidents including fatalities reported to AMSA. It provides an insight into reported marine incident data between 2016 and 2019 in Australian waters.
The vast majority of 2019 reports are of a technical nature (78.4%), with personal consequences representing 14.7% of incident reports.
The increased reporting rate is a positive sign in terms of industry commitment to safety, and suggests that industry engagement initiatives are yielding results. However, the upward trend in serious incidents between 2018 and 2019 indicates that a concerted effort on improving safety, and safety culture should remain a priority for the maritime sector,
…AMSA notes.
Key figures 2016-2019
- Between 2016 and 2019, AMSA received a total of 12,349 marine incident reports.
- There was an increasing number of reports received each successive year.
- The increase in reporting trends specifically of less serious incidents across each year is viewed as a positive trend with more awareness on the importance of reporting marine incidents.
- In 2019, there was a total of 3,371 marine incidents reported to AMSA.
- On average, 96.4% of incidents reported each year are less serious incidents.
- The number of very serious incidents has been stable over the last four years with a total of seven very serious incidents reported between the 2016 to 2019 period. One occurred in 2016 and two annually from 2017 through 2019.
- In 2019, 0.06% of reported incidents were very serious (2), 4.2% serious (141) and 95.8% less serious (3228).
Reported incidents by vessel type
Between 2016 and 2019, 4909 unique vessels were associated with the 12,349 marine incident reports. This represents an average of 2.5 incidents reported per vessel over the four year period. Annually, the average of 1.7 incidents reported per vessel has remained consistent. In 2019, 2004 unique vessels were involved in the 3371 marine incidents reported.
In 2019, the majority (54.5%) of incident reports came from bulk carriers followed by container vessels. This is consistent with previous years’ data.
In 2019, bulk carriers represented 55.4% of reported marine incidents and 50.4% of port arrivals. Although passenger vessels only represented 3.9% of port arrivals, they represented 7.1% of reported incidents. Similarly, special purpose vessels represented 1.4% of 2019 port arrivals but 4.3% of reported incidents.
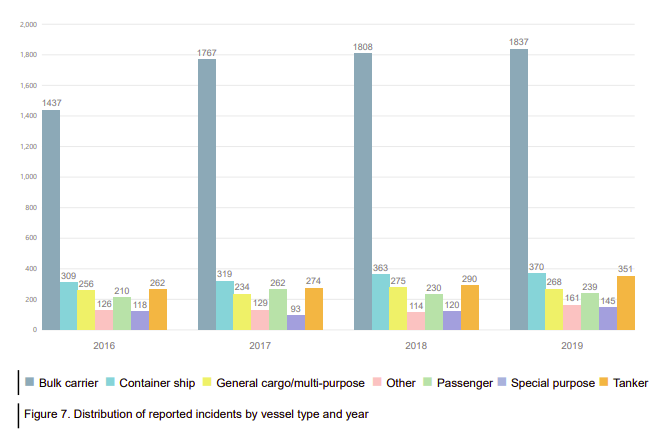
The proportion of very serious and serious incidents in relation to less serious incidents varies by the type of vessel. Although bulk carriers have the highest number of reported incidents, the rate of very serious and serious incidents is proportionally lower (3.2%) when compared to other vessel types. The ‘other’ vessel types (which include tugs, offshore service vessels and other) represent the highest proportion (9.9%) of very serious and serious incidents. This is followed by 7.9% for passenger vessels and 7.7 % for special purpose vessels.
Reported incidents by location
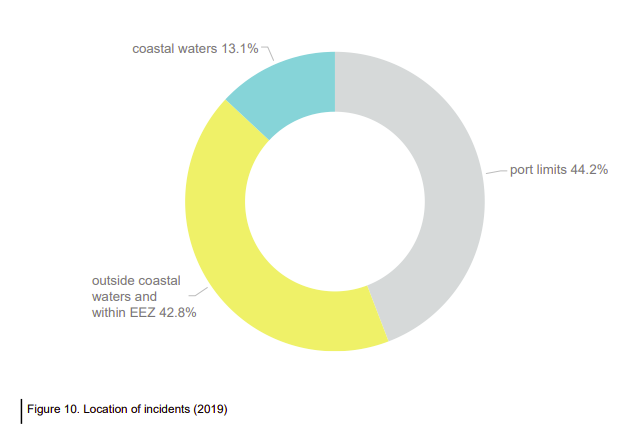
Most incidents in 2019 occurred while the vessel was within port limits (44.2%) with a similar percentage (42.8%) occurring outside of coastal waters3 but within the limits of the exclusive economic zone (EEZ).
Reported incidents by age of vessel
In 2019, vessels more than 15 years old represented approximately 8% of port arrivals and 24% of reported incidents.
Fatalities
Between 2016 and 2019, there were seven fatalities associated with seven incidents. All occurred on foreign-flagged vessels. Six involved crew members and one (in 2016) was a passenger fatality.
Of the six crew fatalities, two involved elevator maintenance, one was a result of an electrical shock and three of the crew fatalities involved falls.
Consequences to vessels
In 2019, 236 incidents resulted in a vessel consequence. The most common vessel consequence occurring in 2019 were contact (24.2%) followed by pollution (23.3%), disablement (15.7%) and close quarters (13.1%).
Although “Other” vessels (including tugs, offshore service vessels and other) only represent 4.8% of reported incidents, they had the highest frequency of incidents in 2019 involving contact (18), and the second highest number of incidents involving pollution (12).
Explore more herebelow:
