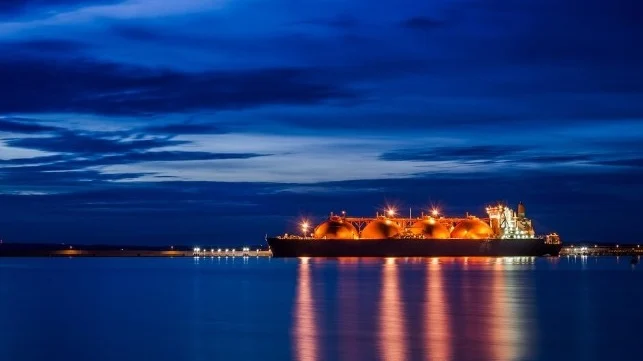
The International Gas Union (IGU) published its 15th edition of the IGU World LNG report, providing a comprehensive review of the global LNG industry and markets after the most turbulent year in its history.
Despite lower price, the growing global LNG market stays tight amid supply constraints, according to the 2024 IGU World LNG Report.
LNG Shipping
Thanks to the mild northern hemisphere winter in 2022, market fundamentals in 2023 were better balanced, which eased freight rates. In September 2023, Europe prepared in advance for winter and pushed the LNG shipping market into the peak season. West of Suez rates reached $117,000/day for steam turbine vessels, $200,000/ day for TFDE/DFDE vessels and $250,000 /day for two-stroke vessels by the end of September 2023, which like the previous year saw a buildup of floating storage. Then, with high gas inventories in Europe and Asia, prices declined again, much lower than at the end of 2022. Due to the post-pandemic re-opening of most economies and the substitution of LNG shipping for pipeline gas in Europe, a total of 7,004 LNG trade voyages departed in 2023, up 1.7% from 2022.
2023 was also characterised by disruptions to the international shipping market. From 3Q 2023, a drought in Panama reduced water levels at Gatun Lake, the water source of the Panama Canal, reducing the number of daily transits and causing US LNG cargoes to take the longer route around the Cape of Good Hope to reach Asia. By early 2024, the situation eased with a recovery in rainfall. However, by then transits through the Red Sea began to be impacted by attacks on vessels by Houthi rebels in Yemen. By February, LNG vessels began avoiding the Red Sea and, by extension, the Suez Canal for transits to Asia and Europe. The market has partially managed these constraints through the use of trading swaps and other optimisations.
With the delivery of 32 vessels in 2023 and 11 vessels across January – February 2024, the global LNG carrier fleet consisted of 701 active vessels as of the end of February 2024, including 47 operational FSRUs and 10 FSUs. This also represents a 5% growth in the fleet size from 2022 to 2023, comparable to a 1.7% growth in the number of LNG voyages, representing a healthy supply of LNG carriers relative to the growth in LNG trade.
Capitalising on better fuel efficiencies and lower emissions, both generations of XDF are currently the main propulsion systems of choice, with at least 141 currently on order. The competing ME-GI system has 16 orders, while the new generation of MEGA system has at least 112. There are still 68 ships equipped with MEGA or XDF systems, and the specific system remains to be confirmed.
LNG Bunkering Vessels and Terminals
Global LNG price experienced severe fluctuations in 2022 and 2023. After skyrocketing to high prices in 2022, global LNG prices have significantly declined 60% y-o-y, providing higher economic viability of LNG as a bunker fuel. It is expected that, with a looser global LNG market in 2024 compared to 2023, the global LNG price will increase the prospects of LNG as a bunker fuel, especially considering the current high oil price environment as of February. These developments are supportive of LNG as a bunker fuel in addition to structural factors such as environmental advantages over fuel oil and chemical compatibility with bio and e-LNG.
There are an additional 9 vessels on the global order book to be delivered. The typical size of vessels ordered is increasing over time, with the average capacity of the active fleet rising to 8,745 cm by the end of 2023, up from 7,700 cm in 2022. The order book averages 8,478 cm.
Regasification Terminals
As of end-February 2024, global regasification capacity registered 1,029.9 MTPA across 47 markets. In 2023, 69.9 MTPA of regasification capacity addition was seen, with commissioning of 16 new LNG import terminals and one expansion project of an existing terminal, and with the largest new capacity of the year from Hong Kong FSRU (Bauhinia Spirit), a floating, storage and regasification unit project in China, at 6.1 MTPA.
Global regasification capacity additions speeded up in 2023, with 17 (one expansion and 16 new) projects online across 10 markets, compared with 11 projects commissioning across 8 markets in 2022. The highest capacity addition occurred in Europe at 30 MTPA, followed by 26.9 MTPA from Asia region, and 13 MTPA from Asia Pacific. Out of the 69.9 MTPA regasification capacity additions in 2023, 65.1 MTPA were from 16 new terminals and 4.8 MTPA from an expansion project at an existing terminal.
Global regasification utilisation saw a downward trend in 2023, dropping from 43% on average in 2022 to 41%. Tepid demand in the main regional markets, including Europe and Asia Pacific, and sizable new start-ups of regasification terminals in 2023 dragged down global average utilisation.
Floating and Offshore Regasification
There are 49 floating and offshore terminals around the world, with a total regasification capacity of 200.9 MTPA as of end-February 2024. They make up around 20% of global regasification capacity. Nine new floating-based projects were commissioned in 2023, with a capacity addition of 40.3 MTPA.
17 floating and offshore terminals are under construction as of endFebruary 2024, with a combined capacity of 52.1 MTPA. This includes 28 MTPA from Asia and Asia Pacific, 9.8 MTPA from Europe, 10.2 MTPA from Latin America and 4.2 MTPA from Africa. India is leading in terms of newbuild of floating-based projects, with three projects or 16 MTPA to be online in 2025-2026. Since 2022, the surge in FSRU demand in Europe implies many projects in emerging Asia may be
delayed given the limited number of FSRUs.
LNG Trade Price Trends
Global LNG trade grew by 2.1% between 2022 and 2023 to about 401.42 million tonnes (MT), connecting 20 exporting markets with 51 importing markets. Despite the materially lower price environment driven by the warm northern hemisphere winter of 2022, resulting in significantly lower energy consumption, and slow demand recovery, LNG trade growth was limited by the lack of LNG supply growth, with Tangguh LNG Train 3 in Indonesia the only new facility to start
production last year.
Asia Pacific remained the largest exporting region with 134.80 MT in 2023, a 0.32 MT decrease compared to 134.49 MT in 2022. The Middle East continued as the second-largest exporting region with 94.69 MT in 2023, a 1.84 MT decrease compared to 96.53 MT in 2022. The thirdlargest exporting region was North America, with 84.53 MT, an 8.90 MT increase compared to 75.63 MT in 2022, driven by the return of Freeport LNG in the US to full production and Calcasieu Pass, also in the US, ramping up production. In February 2024, the Marine XII FLNG facility in Congo began LNG exports.
2023 saw LNG markets eventually regain equilibrium. Platts JKM, Asia’s price reference for LNG, averaged $13.86/million British thermal units (mmBtu) during the year, close to its 10-year average of $12.01/mmBtu. Ahead of many analysts’ expectations, in Q1 2024 JKM was below long-term oil-linked contract prices.
The rebalancing was aided mostly by consumption changes, including significantly lower seasonal demand, due to weather, as well as higher nuclear power generation, renewables deployment, energy saving measures, energy efficiency improvements, and demand reductions from the industrial sector in Europe and OECD Asia, with LNG supplies only marginally improving versus the previous year. Traditional North Asian importers pared back on LNG purchases, with Japan, South Korea and Chinese Taipei reducing intake YOY, while Europe’s LNG imports remained largely stable. As markets returned closer to longterm average prices, South Asian markets showed demand growth, and several markets imported their first LNG cargoes. The recent LNG demand growth engine, China, saw imports rebound, albeit to a lower total level when compared with its 2021 peak.


