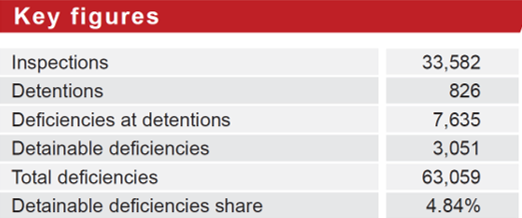
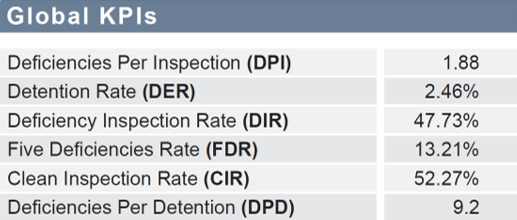
Many operators monitor specific KPIs, but these are not necessarily make the difference; it is not only the detention ratio, but country, port, age, and ship type that matter. Analyzing more than 33,500 inspections and related data from RISK4SEA – the online intelligence platform providing PSC inspection analytics & benchmarking – the global KPIs for the first semester of 2019 show 1.88 deficiencies per inspection, in comparison to the last running quarter which was 1.76. The detention rate is 2.46%, and the clean inspection rate is 52%.
Detentions Data 2019 Q1&Q2
PSC Analytics to strengthen decision making / Source: RISK4SEA
In general, a useful KPI to monitor is the deficiencies per detention (DPD). It is the number of deficiencies marked during detentions divided with the number of detentions. This KPI shows a clear number of the average deficiencies per detention. What we can get from it? We can learn how strict a PSC area is. The lower the DPD is the stricter the PSC are is. It is not the same to detain a ship with few findings while in other places the detention is the outcome of many deficiencies.
PSC Analytics to strengthen decision making / Source: RISK4SEA
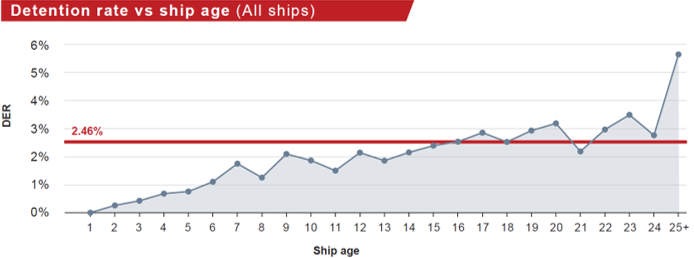
The average detention rate per ship is 2.46% meaning that age matters. No matter the type, ships older than 15 years old are more easily detained, mainly caused by maintenance problems and older technology on board.
Age Factor on Detentions
PSC Analytics to strengthen decision making / Source: RISK4SEA
As explained, ship type matters as well. For example, the detention rate for the general cargo is 6.98%, for bulk carriers it is 2%, more than the average. The number of detentions for bulk carriers 6-10 years is 104, meaning that these ships are a targeted area.

PSC Analytics to strengthen decision making / Source: RISK4SEA
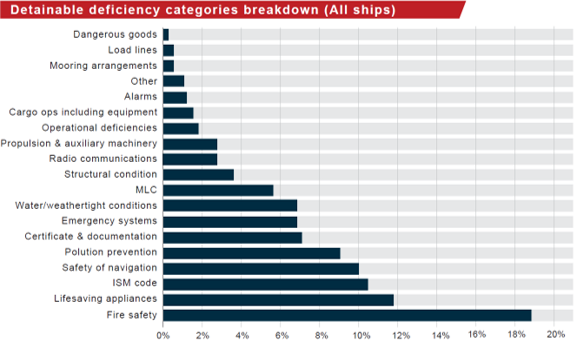
Regarding the detainable issues, fire safety is the number one reason for the first semester of 2019. However, the list of issues for a specific ship type, MoU, or country, is different. In fact, the most common detainable deficiency by far is ISM documentation since the documentation requirements (certificates, endorsements, contracts etc) are either missing or include wrong information. Also, fire on board remains one of the most difficult emergencies to respond and thus PSC Officers worldwide give attention to this item during inspection.
PSC Analytics to strengthen decision making / Source: RISK4SEA
PSC Analytics to strengthen decision making / Source: RISK4SEA
Analysis of the detentions per operator and ship indicated operators with 81% with one detention, and eighty companies with two detentions. However, it is wrong to conclude that these eighty companies have poor performance because they include companies that are big names, controlling more than 50-70 ships. This means that when the ships are many, more inspections are being conducted. And if an operator has more inspections, even with 1% detention index, he/she may end up with two detentions, in one semester, or one year. That’s not necessarily bad indication.
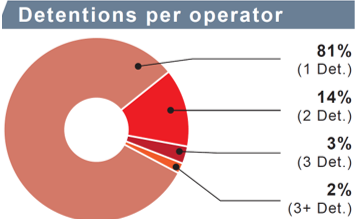
PSC Analytics to strengthen decision making / Source: RISK4SEA
Regarding detentions per ship, 95% have one detention, but there are ships with more than two detentions.
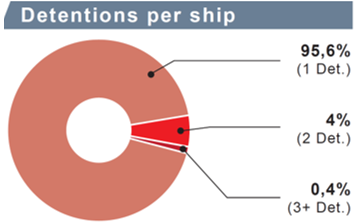
PSC Analytics to strengthen decision making / Source: RISK4SEA
Analyzing the detentions per operator-based country, we see which countries are targeted. The operators for example based in China, Greece, Turkey, Germany are targeted more, because they have a significant amount of inspections. Even if you think China and Greece have a huge fleet, that’s not the case for Turkey.
For example if we compare the detentions for operators (taking into consideration the operator’s country base) and we compare two countries (eg Greece and Turkey), we can not only count number of detentions. Referring to Greece and Turkey, they have almost the same share in detentions (Greece has 11.5% and Turkey 10.2%) and one could say that the performance of Turkish based companies is better. But taking all the picture with the share of inspections where Greece based fleet has 15% of global and Turkish based fleet only the 3.5%, it is understandable that the performance of Greece based fleet is better.
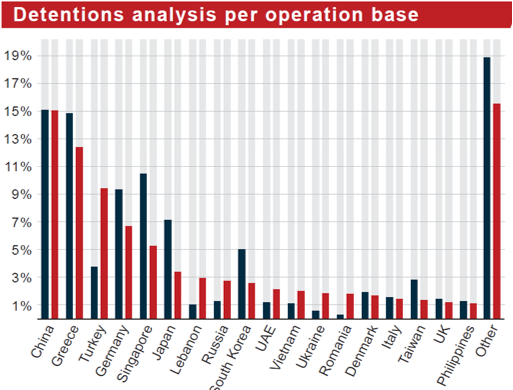
PSC Analytics to strengthen decision making / Source: RISK4SEA
In conclusion, analytics are getting trickier every year to analyze; in essence, a number of factors are in play, for instance several ports/ countries are inconsistent with the MOU or the global benchmarks; several non-reasonable fluctuations do exist, across the globe and; larger organizations have been more resilient in handling deficiencies and detentions. Certainly, analytics can make or break by providing useful insights!


