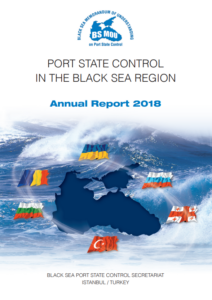
The Black Sea MoU issued its annual PSC report, noting a a detention percentage of 5.33% in 2018. A total of 278 detentions were warranted to ships found with serious deficiencies, representing an 1.77% decrease as compared with 283 detentions in 2017.
Key figures
- During 2018, the BS MoU member Authorities conducted a total of 5,214 inspections, representing slight 2% increase as compared with 5,112 initial inspections in 2017.
- The regional inspection rate is 72.33% which is 1.26 % increase as compared with 2017.
- 5,468 individual ships visited inspection ports in the Black Sea region in which 3,819 (69.84%) individual ships were inspected and 241 (6.31%) individual ships were detained.
- The number of individual ships inspected in 2018 (3819) increased 3.0% compared with the number of individual ships inspected in 2017 (3,707) despite to 4.8% decrease of the individual ship visits in 2018 as compared with 5,216 individual ship visits in 2017.
- The overall detention percentage in the region was 5.54% in 2017; in 2018 it decreased up to 5.33% as a per cent of inspections, rather than the number of individual ships inspected to take into account that many ships are detained more than once during any one year.
- Regional detention rate (percentage of number of individual ships inspected) 6.31% is which is higher than 5.75% in 2017.
- The number of ships detained in 2018 for deficiencies clearly hazardous to safety, health or environmental amounted to 278.
- It compares with the number of detained 283 in 2017, 223 in 2016. Number of inspections increased 102 (2.0%), total number of detentions decreased 5 (1.7%) which resulted 0.21 % decease in detention percentage in 2018.
Inspection data by Flag
- Inspections were carried out on ships registered under 80 flags.
- The flag State with largest number of ships inspected in the region was Panama with 835 (16.01%) inspection followed by Malta with 533 (10.22%) and Marshall Islands with 496 (9.51%) which constitute 1,864 (35.75%) of total inspections.
- In 2018, ships registered under 39 foreign flags were observed to have deficiencies sufficiently serious to impair the seaworthiness and warrant detention. High detention percentage observed Comoros (18.18%), followed by Tanzania (15.65%) and Togo (15.33%) flagged vessels.
Inspection data by Ship Type
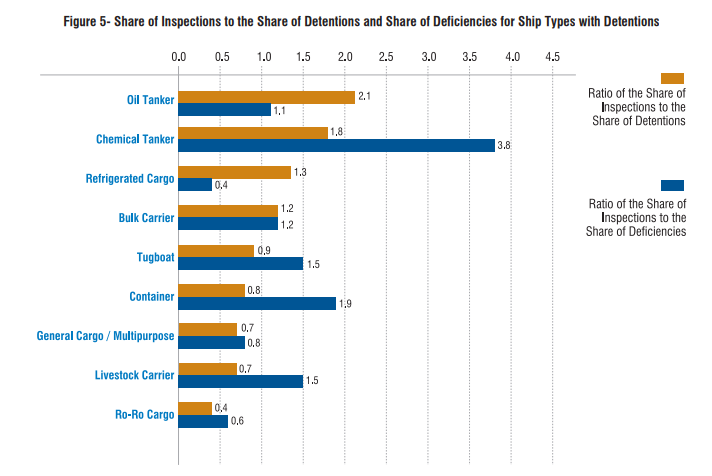
- The largest group of the ship inspected during 2018 were general cargo/multi purpose ships with 1,890 (36.2%) inspections; bulk carrier 1,850 (35.5%) and oil tanker 619 (11.9%) were also inspected which represent 83.6% of inspections
- Majority of detained ships were type of general cargo/multi purpose ships with 164 (59.0%) detentions, bulk carriers with 66 (23.7%) detentions and oil tanker with 14 (5.0%) detentions, followed by chemical tanker with 3 (1.1%) detentions, which were accounted for 88.8 per cent of the total detentions.
- Higher per cent of detentions were with Ro-Ro cargo ship (20.6%), general cargo/multi-purpose ships (8.7%), followed by livestock carrier (5.3%), and tugboat (3.6%) (number of inspections more than 10).
Inspection data by Deficiency
- A total of 21,006 deficiencies were recorded during the port State control inspections in 2017.
- Majority of the deficiencies found upon inspection in 2017 were related to safety of navigation (16.4%), life saving appliances (13.3%), fire safety measures (10.4%) and health protection, medical care, social security (9.1%). These four categories make up 49.2% of the total deficiencies found.
- Number of ISM related detainable deficiencies were 544 which accounted for 2.54% of the deficiencies, 256 marine pollution MARPOL Annex I related deficiencies observed accounting 1.19% of the total deficiencies.
- A total 948 detainable deficiencies and 46 RO related detainable deficiencies were recorded during the port State control inspections. 4.4% of total deficiencies in 2018 were detainable deficiencies, 4.8% of detainable deficiencies in 2018 were RO related.
- Majority of the detainable deficiencies found upon inspections in 2018 were related to fire safety (14.5%), lifesaving appliances (14.3%), emergency system (14.0%) followed by safety of navigation (11.9%). These five categories make up 64.6% of the total detainable deficiencies found in 2018.
- Majority of the RO related detainable deficiencies found upon inspection in 2018 were related to fire safety (26.1%), Structural Condition (23.9%), Emergency Systems (10.9%), safety of navigation (10.9%) and followed by ISM (8.7%). These five categories make up 80.4% of the total RO related detainable deficiencies found.

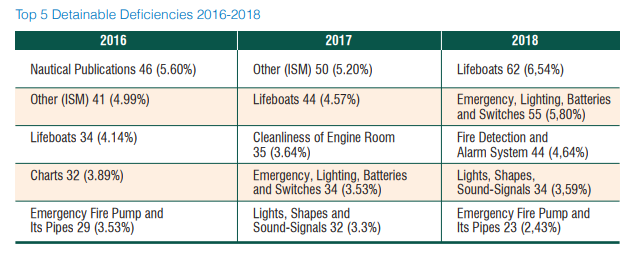
The following table depicts the top 5 detainable deficiencies for the 2016-2018 period:
MLC results
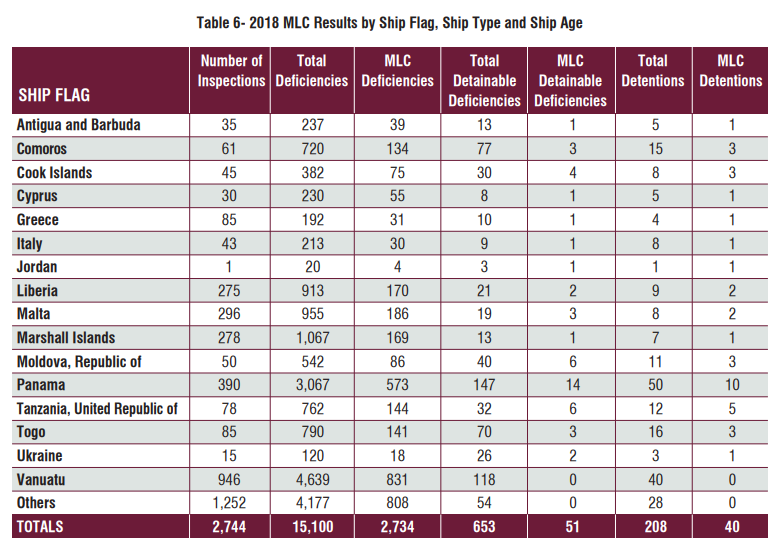
- PSCOs from Bulgaria, Romania and the Russian Federation identified 2,734 deficiencies related to MLC 2006 issues. This represented 18.1% of the total deficiencies issued and equated to 1.0 deficiency per inspection.
- Of the 653 detainable deficiencies 51 were related to MLC detainable deficiencies. This represented 23.2% of the total detainable deficiencies. Of the 208 detentions 40 (19.2%) were due to the MLC, 2006 related detainable deficiencies which resulted 1.46 detention percentage.
Explore more herebelow:


