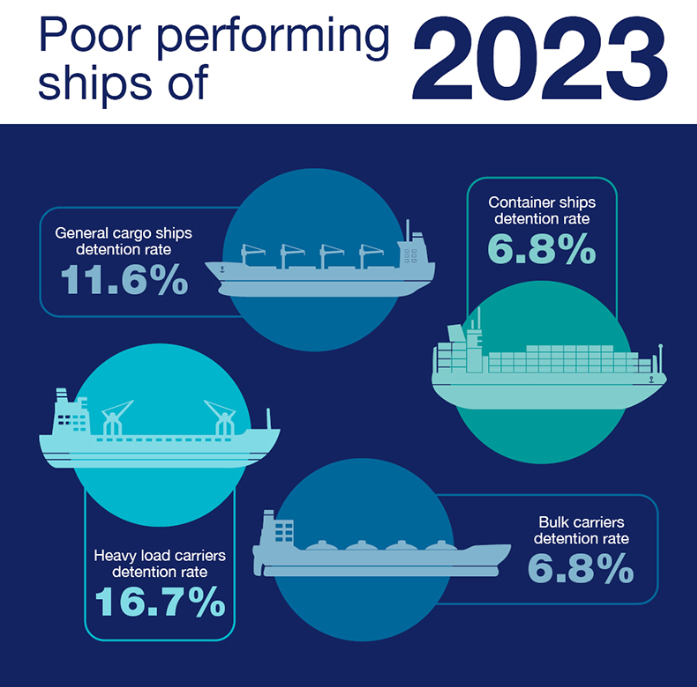
Australian Maritime Safety Authority (AMSA) has issued its Inspection Report for year 2023 revealing that heavy load carriers were the poorest performing ships in 2023, with a detention rate of 16.7%.
According to the AMSA Inspection Report, offshore service vessels were the next poorest performing ship type with a detention rate of 12.5% percent. General cargo/multi-purpose ships were the next poorest performing ship type with a detention rate of 11.6%, followed by chemical tankers with a detention rate of 8.1 % and gas carriers with a detention rate of 7.5%.
Container ships dropped out of the top 5 poorest performing ship types in 2023 with a 6.8% detention rate, a notable improvement from the 2022 rate of 8.3% but still above the 6.3% average for all ship types.

The rate of deficiencies per inspection for container ships was 3.59, well above the 2.68 average deficiency rate for all ship types. AMSA is continuing to focus on enforcing the minimum international standards for container ships including the proper stowage and securing of containers and maintenance of cargo securing equipment.
In 2023, bulk carriers exited the top 5 poorest performing ship types after being on the list for 7 years. This is significant as bulk carriers are the most frequently inspected foreign flagged ship in Australia, with 1,444 PSC inspections conducted in 2023.
The detention rate for bulk carriers in 2023 however was 6.8%, higher than the 2022 rate of 6.4% and above the 6.3% average for all ship types. This indicates that the performance of bulk carriers has not improved despite dropping out of the top 5 poor performing list.
The rate of deficiencies per inspection for bulk carriers was 2.84, slightly above the 2.68 deficiency rate for all ship types.
| PSC inspections | 2022 | 2023 | Change | Details |
|---|---|---|---|---|
| Total PSC inspections | 2,405 | 2,797 | +16.3% | (an increase of 392) |
| Total PSC inspections – by individual ships | 2,167 | 2,477 | +14.3% | (an increase of 310) |
| Inspection rate of eligible ships % | 36.8% | 40.8% | +10.9% | (an increase of 4%) |
| Total deficiencies | 6,216 | 7,491 | +20.5% | (an increase of 1,275) |
| Total detainable deficiencies | 220 | 263 | +19.5% | (an increase of 43) |
| Rate of deficiencies per inspection | 2.58 | 2.68 | +3.88% | (an increase of 0.1) |
| Total detentions | 145 | 176 | +21.4% | (an increase of 31) |
| Detentions as a % of total inspections | 6.0% | 6.3 % | +5.0% | (an increase of 0.3% of inspections) |


