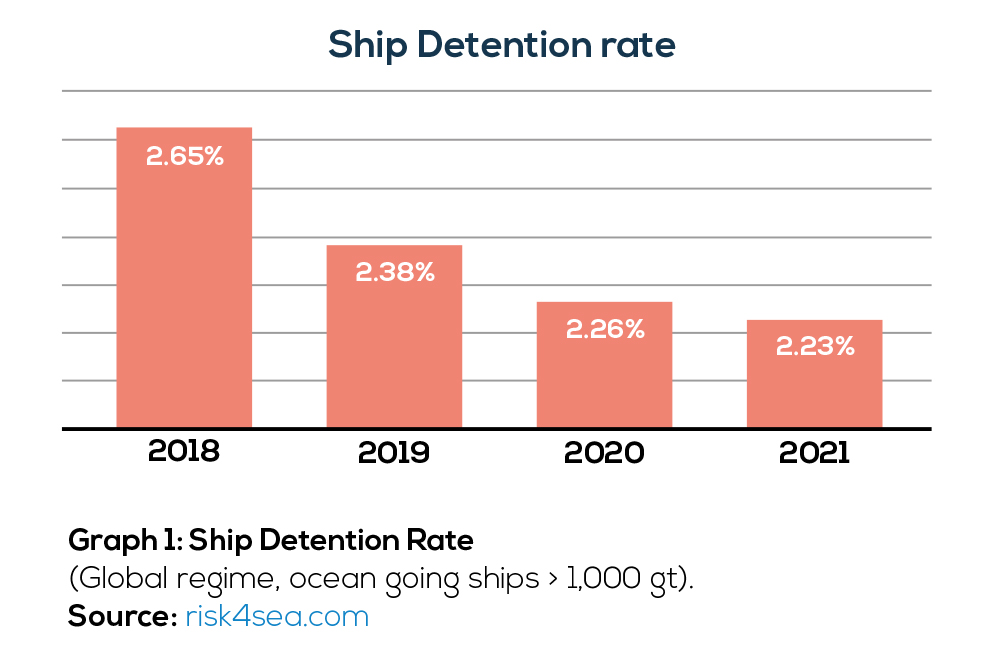
During 2021, an increased number of inspections and detentions was noticed in comparison with 2020. A total of 1,394 detentions marked worldwide on all ship types. The global Detention rate (for all ship types) has been marked to 2.23%, while the last 3 years (2018-2019-2020) average was 2.43% (Graph 1).
Different PSC regimes and MoUs showed various levels of detention rate during 2021. This mostly has to do with the different approach of each PSC area. (Table 1)
| PSC Regime | Paris | Tokyo | USCG | Med. | Black Sea | Vina Del Mar | Indian Ocean |
| DER | 3.69% | 2.01% | 1.15% | 2.34% | 3.25% | 0.63% | 3.58% |
Table 1: Detention Ratio within 2021 (Ocean going ships > 1,000 gt)/ Source www.risk4sea.com
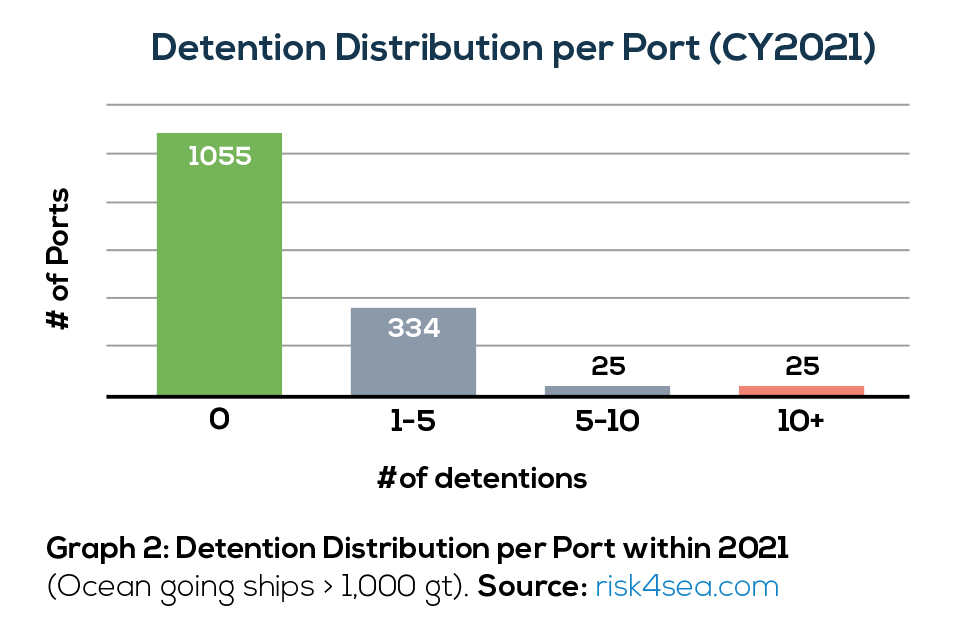
The PSC regime worldwide conducted inspections in 1,440 ports. From those ports, a number of 1,055 marked 0 detentions. This gives an impressive number of 74% of ports with inspections without detentions. The remaining 384 marked the total number of 1,394 detentions.
The most challenging port in terms of total detentions during 2021 was Novorossiysk, Russia, with 87 detentions totally. The 2nd and 3rd ports in respect of number of detentions were Antwerp, Belgium with 35 detentions and Port Hedland Australia with 29 detentions.
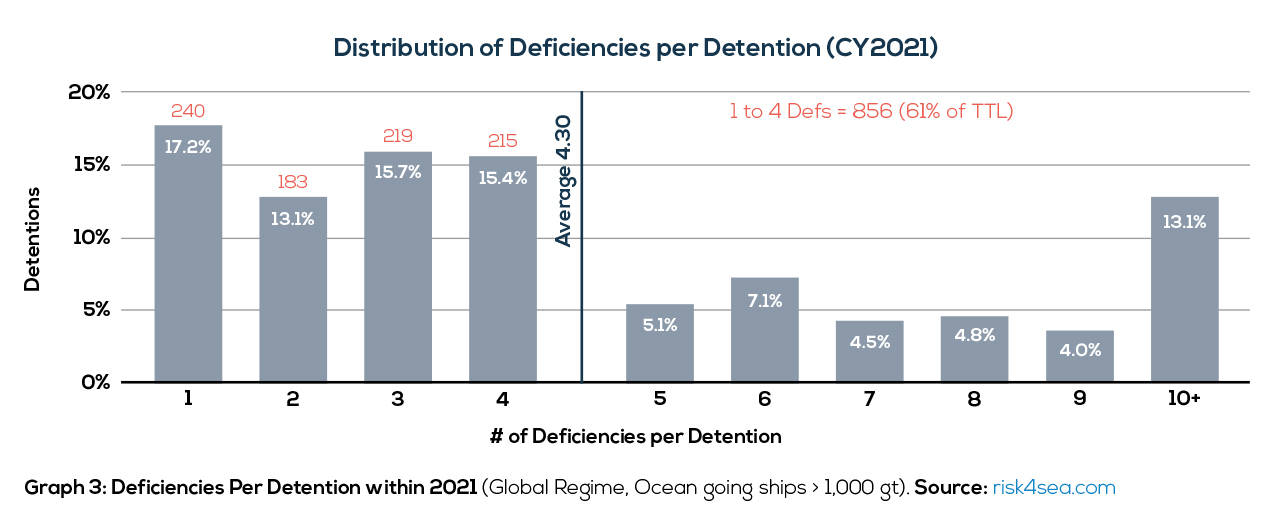
It is reasonable to expect that a detention is a result of many deficiencies identified by the PSC Officer with the deficiency action code 30 (which means “Ship Detained”). There is however a very useful KPI, called Deficiencies per Detention (DPD). This KPI indicates the average number of ALL deficiencies (detainable and others) marked per each detention. The average DPD for 2021 was 4.30.
 Why DPD is important as a KPI?
The lower the DPD, the most challenging the inspection. Given the access to past PSC inspection data, a prudent manager may proactively guess the red Flags well in advance by a number of ways. As shown in Graph 3, 61% of all detentions had a maximum of 4 deficiencies. More specifically, a number of 240 detentions (17.2% of TTL) ended with ONLY 1 deficiency. Depending on the finding, the PSCO may detain the ship for just one item (according to PSC Procedures).
| Detainable Deficiency Code | Deficiency Category | % Share |
| 15150 -ISM | ISM Code | 7.05% |
| 11101 – Lifeboats | Life Saving Appliances | 2.17% |
| 07106 – Fire Detection and alarm system | Fire Safety | 2.05% |
| 11104 – Rescue Boats | Life Saving Appliances | 2.0% |
| 04102 – Emergency Fire pump and its pipes | Emergency Systems | 1.96% |
| 07105 – Fire doors/openings in fire resisting divisions | Fire Safety | 1.89% |
| 04114 – Emergency Generator | Emergency Systems | 1.84% |
| 07115 – Fire Dampers | Fire Safety | 1.71% |
| 04109 – Fire Drills | Emergency Systems | 1.64% |
| 10111 – Charts | Safety of Navigation | 1.52% |
Table 2: Detainable Deficiency Code Distribution within 2021 (Global Regime, Ocean going ships > 1,000 gt). Source www.risk4sea.com
Key Findings
- ISM (15150 code) is used as an “umbrella” to accompany serious situations or to require an additional internal audit for SMS implementation.
- Lifeboats & rescue boats (codes: 11101 & 11104) have a combined share of 4.2% of detainable deficiencies.
- Fire safety related codes (07106, 07015, 07115) have a combined share of up to 5.65% and emergency systems (codes 04102,04114,04109) have a combined share of 5.44%.
- Despite the digitalization of the bridge and navigation systems, the code 10111-Charts is still in the top 10 of detainable deficiencies.
Can a ship avoid being detained?
Absolutely; basically by reviewing past PSC performance of Port, Ship and the Manager record, detentions do happen. There should be no shame on detentions if the Manager and the Ship extract the lessons learned to avoid similar future incidents. The key to avoid detentions (or minimize the PSC inspection severity and/or possibility of a detention occurrence) is preparation. A focused, detailed preparation for an inspection using data for specific Port/PSC regime is the best way towards an effective PSC performance.


