While every port operates under a specific set of PSC procedures and ships are prepared to be inspected in line with the priorities set by the MoU and the Port it is a common understanding that this may not be the case at all times. The industry is expecting a figure in the range of 5% in terms of ships inspected vs ship calls and our investigation has identified that this may be a lot further than the truth.
The figure does matter due to the fact that we have identified several significant fluctuations of the figure in several ports and fleet segments while at the same time, the higher the figure the more probable it is for the ship of being inspected irrespective of the Inspection Window being due in line with MoU guidelines.
→ An IVC of 100% mean that ALL unique ships called in a port are being inspected
Having that in mind, we introduce the Inspections vs Calls KPI (IVC%), that will help us further analyze the subject and produce some meaningful results with an outline of the ports distribution with respect to IVC in the global regime as follows:
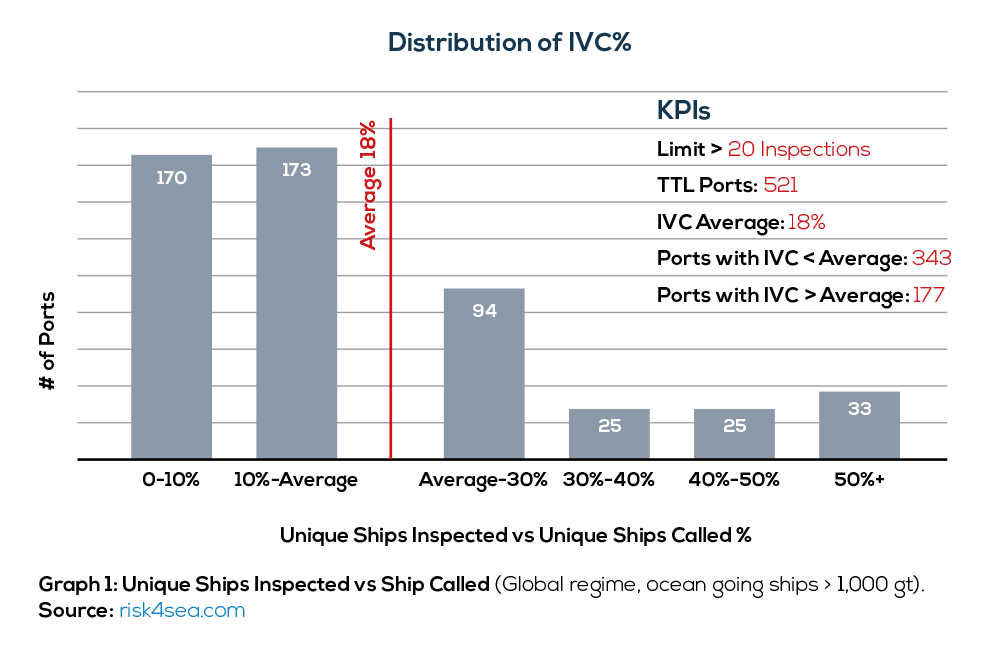 The histogram clearly indicates that the majority of the ports (343 in total) are below the average, however there are 177 ports with IVC above the average of 18%, while 33 ports have a figure in the range of 1 out of 2 (i.e. 50%) ships called are being inspected.
| Port | Country | PSC Inspections | Unique Ships Inspected | Ship Calls | Unique Ships Called | IVC% |
| Busan | S.Korea | 288 | 243 | 10,868 | 1,302 | 19% |
| Singapore | Singapore | 334 | 318 | 14,226 | 1,764 | 18% |
| Rotterdam | Netherlands | 146 | 145 | 6,413 | 828 | 18% |
| Shenzhen | China | 253 | 215 | 6,452 | 1,233 | 17% |
| Antwerp | Belgium | 107 | 106 | 3,806 | 695 | 15% |
Table 1: Containers > 1,000 gt, Selected Ports, CY 2021, source: risk4sea.com
Key Highlights for containers (Table 1)
- The IVC average for containers on all ports for CY 2021 is 14% for 88 ports, below the global average of all ships, while containers as a sector are calling in specific ports.
- Approximately 1 out of 5 Containers are subject to inspection on key ports.
| Port | Country | PSC Inspections | Unique Ships Inspected | Ship Calls | Unique Ships Called | IVC% |
| Port Hedland | Australia | 564 | 421 | 2,861 | 945 | 45% |
| Vancouver | Canada | 262 | 258 | 1,696 | 920 | 28% |
| New Orleans | USA | 276 | 262 | 2,160 | 1,338 | 20% |
| Tianjin | China | 395 | 283 | 2,230 | 1,658 | 17% |
| Newcastle | Australia | 222 | 152 | 1,882 | 1,153 | 13% |
Table 2: Bulk Carriers > 1,000 gt, Selected Ports, CY 2021, source: risk4sea.com
Key Highlights for bulk carriers (Table 2)
- The IVC average for bulk carriers on all ports for CY 2021 is 24% for 224 ports, above the average of the global fleet while the Bulk Carrier fleet is also calling on more ports than other sectors.
- Port Hedland has by far a leading figure of IVC of 45%, substantially exceeding the sector’s average.
- Vancouver follows with 28%, meaning 3 out of 10 bulk carriers are subject to inspection.
| Port | Country | PSC Inspections | Unique Ships Inspected | Ship Calls | Unique Ships Called | IVC% |
| Piraeus | Greece | 46 | 46 | 2,942 | 127 | 36% |
| Gibraltar | UK | 56 | 54 | 3,279 | 170 | 32% |
| Dumai | Indonesia | 225 | 176 | 2,932 | 741 | 24% |
| Houston, Texas | USA | 137 | 137 | 3,640 | 1,146 | 12% |
| Antwerp | Belgium | 160 | 159 | 3,975 | 1,254 | 13% |
Table 3: Oil Tankers > 1,000 gt, Selected Ports, CY 2021, source: : risk4sea.com
Key Highlights for oil tankers (Table 3)
- The IVC average for oil tankers on all ports for CY 2021 is 15% for 114 ports, below the global average of all ships, while oil Tankers as a sector are calling in less/specific ports.
- The ports of Gibraltar and Piraeus, used mainly for bunkering or supplying purposes, have a generally high IVC percentage with managers preferring these ports for inspections.
- The ports of Antwerp, Houston and Dumai lean towards the average, regardless the fact that as Oil cargo ports are expected to have an increased Inspections vs Calls ratio.
Overall, ship managers can find such statistics extremely useful to better understand the application of PSC Regimes in every port and prepare their ships accordingly for inspection, despite any MoU criteria on the Inspection window Open Date.


