The power sector is the single biggest market for energy, absorbing over 40% of primary energy in 2017, and leading the energy transition, through renewables and electrification, according to BP’s Statistical Review of World Energy. This year’s review for the first time includes comprehensive data on the fuel mix within the power sector, boosting understanding of this key sector.
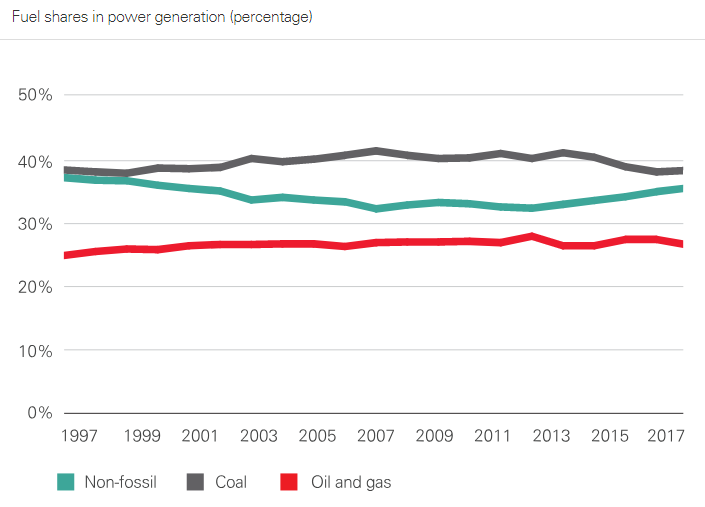
Highlights In 2017, global power generation increased by 2.8%, close to its 10-year average, and almost all this growth came from the developing world. OECD demand edged up slightly, but essentially the decoupling of economic growth and power demand in the OECD seen over the past 10 years continued, with OECD power broadly flat over the past decade, according to Spencer Dale, BP Group chief economist. The increase in global power generation was driven by strong expansion in renewable energy, led by wind (17%, 163 TWh) and solar (35%, 114 TWh), which accounted for almost half of the total growth in power generation, despite accounting for only 8% of total generation. Although wind continued in its role of the bigger, more established, elder cousin, it was solar energy that made all the waves. In particular, solar capacity increased by nearly 100 GW last year, with China on its own building by over 50 GW – that is roughly equivalent to the generation potential of more than two-and-a-half Hinkley Point nuclear power plants. Global solar generation increased by more than a third last year. Much of this growth continues to be underpinned by policy support. But it has been aided by continuing falls in solar costs, with auction bids of less than 5 cents/KWh – which would have been unthinkable for most projects even just a few years ago – now almost common place. Standing back from the detail of what happened last year, the most striking – and worrying – chart in the whole of this Statistical Review is the trends in the power sector fuel mix over the past 20 years. –>Worrying: Because the power sector is the single most important source of carbon emissions from energy consumption, accounting for over a third of those emissions in 2017. To have any chance of getting on a path consistent with meeting the Paris climate goals there will need to be significant improvements in the power sector. But this is one area where at the global level we haven’t even taken one step forward, we have stood still: perfectly still for the past 20 years. This chart should serve as a wake-up call for all of us.
 –>Striking: Despite the extraordinary growth in renewables in recent years and the huge policy efforts to encourage a shift away from coal into cleaner, lower carbon fuels, there has been almost no improvement in the power sector fuel mix over the past 20 years. The share of coal in the power sector in 1998 was 38% – exactly the same as in 2017 – with the slight edging down in recent years simply reversing the drift up in the early 2000s associated with China’s rapid expansion. The share of non-fossil in 2017 is actually a little lower than it was 20 years ago, as the growth of renewables hasn’t offset the declining share of nuclear. I had no idea that so little progress had been made until I looked at these data


