


EIA estimates that between 2014 and 2017 natural gas processing capacity and processing throughput increased by around 5%, even as the number of individual plants reduced. Natural gas processing plant utilization rates stayed still at 66% from 2014 to 2017, but numerous states saw significant changes, largely reflecting changes in natural gas production across regions.
As of the end of 2017, 510 active natural gas processing plants were operating in the Lower 48 states with an overall processing capacity of 80.8 billion cubic feet per day. On average, these plants processed about 53.3 Bcf/d, operating at about 66% of capacity.
[smlsubform prepend=”GET THE SAFETY4SEA IN YOUR INBOX!” showname=false emailtxt=”” emailholder=”Enter your email address” showsubmit=true submittxt=”Submit” jsthanks=false thankyou=”Thank you for subscribing to our mailing list”]
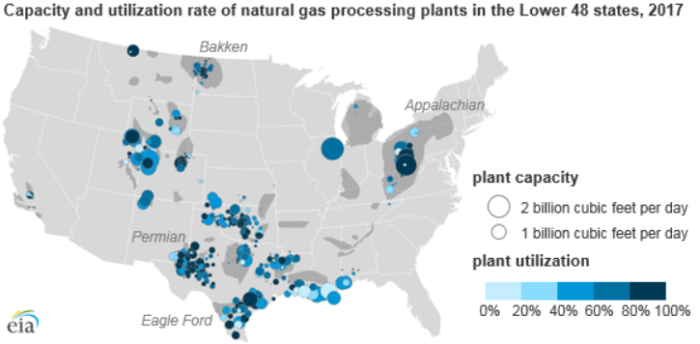
Regions with advanced natural gas production, such as Texas (Permian, Eagle Ford), West Virginia (Marcellus, Utica), and North Dakota (Bakken), presented the largest increase in natural gas processing capacity and throughput between 2014 and 2017. In West Virginia, increases in the use of existing plants drove increase in throughput from 2014 to 2017 that surpassed its increase in processing capacity.
At the national level, EIA says, that utilization rates remained flat between 2014 and 2017, although some states indicated more significant changes. For example, in the Bakken region – Montana and North Dakota – both utilization rates and capacity increased, along with increases in natural gas production. At the same wavelength, Ohio and West Virginia, in the Appalachian Basin in the Northeast, also showed large increases in capacity and utilization.
Nevertheless, in states such as Texas and Oklahoma, processing capacity grew more than throughput, cause a slightly lower utilization in those states. Texas’s lower utilization rate may be partly explained with the state’s natural gas production reduction between 2014 and 2017.