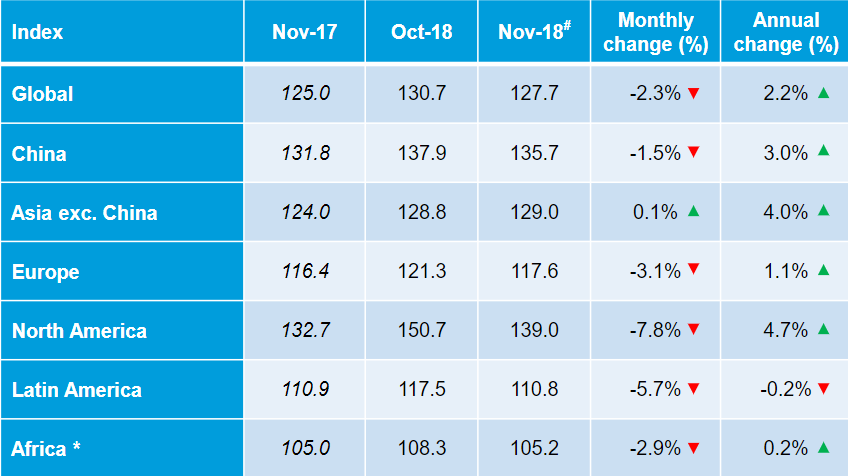
Drewry’s Container Port Throughput Indices are a series of volume growth or decline indices based on monthly throughput data for a sample of over 220 ports worldwide, representing over 75% of global volumes. The base point for the indices is January 2012 = 100.
According to Drewry’s latest assessment on January 2019:
- After reaching 130.7 points in October 2018, which is the highest level to be reached in the last seven months, the Drewry Container Port Throughput index decreased to 127.7 in November 2018. Yet, it was close to three points up on an annual basis when compared to November 2017.
- All regions experienced a monthly decrease during November 2018 except Asia, for which the Index was almost similar for October and November 2018. November’s decrease is an unusual phenomenon and is not experienced in recent years. The most possible factor of this decline, is the US-China tariff war changing and disrupting supply chains.
- North America witnessed the most challenging decline, after a 10.5 point growth in October 2018. The Index was at 139 in November 2018 compared to more than 150 points in October 2018. However, the index was more than six points (4.7%) up compared to November 2017. Strong growth seems to be steadily, yet slowly.
- Latin America followed the trend with close to seven points (5.7%) monthly decline in November 2018. However, it was almost the same compared to November 2017.
- The largest region China was also in the same league by witnessing two points (1.5%) decline in November 2018. However, the index was four points up compared to November 2017.
- Europe and Africa both witnessed around 3% monthly decline in November 2018. On an annual basis, the index was 1% higher for Europe whereas it was almost unchanged for Africa.


