Xeneta explains how massive shifts in global trading patterns in 2024 have made the task of managing and optimizing supply chains even more complex.
According to Xeneta, this is perfectly demonstrated on the trade from the Far East to South America East Coast where a record-breaking 1.6m TEU (20ft shipping container) was shipped in the first nine months of the year – driven by exports from China, which are up 14.8% compared to 2023.
Alongside the record-breaking volume on this trade is an all-time high in offered capacity, which averaged 63 900 TEU in the first four weeks of October (30 September to 27 October). This is an increase of 73% compared to the same period in 2023.
Prior to 2024, the four week average of capacity on this trade had never been above 50 000 TEU, but that mark has now been passed 13 times.

Shifts of this magnitude can bring uncertainty and unintended consequences. Having visibility on long and short term freight rates is essential, but shippers must also have data on capacity, transit times and schedule reliability. Whether you are a shipper already utilizing this trade lane or considering moving volumes onto it, without this data and insight you cannot fully understand and measure the impact of these shifting trade patterns.
A breakdown of record capacity
Data in the Xeneta platform shows year-on-year increases in offered capacity on all services operating between the Far East and South America East Coast in the four week period ending on 27 October.
The biggest increase came on the ESA/SA3/ASE1 service jointly operated by CMA CGM, COSCO, Evergreen and PIL. Offered capacity more than doubled on this service from the same period in 2023 with four ships deployed compared to just one last year.
Note: the major East-West alliances don’t operate between the Far East and South American East Coast. Instead, most services are operated jointly by several carriers outside of usual alliance partnerships.
The standalone Carioca service operated by MSC is the one new service operating on this trade lane in 2024. In the four week period ending in week 43, it saw a weekly average of 11 100 TEU deployed. The Carioca service connects South Korea and China to Southern Brazil, including stops in Singapore and Colombo.
This service almost doubles MSC’s presence on the Far East to South America trade. Its other service, offered in partnership with Hapag-Lloyd and ONE, had an average weekly capacity of 11 500 TEU in the same four week period.
Deteriorating transit times and schedule reliability
While shippers may be enjoying record-high capacity between the Far East and South America East Coast, data in the Xeneta platform shows the highest transit times on record for this trade and the lowest ever recorded schedule reliability.
Xeneta’s new transit time feature allows users to follow the transit times carriers have announced – as well as the actual results.
In the second half of 2024, carriers have promised an average journey of 38 days within a range of 34-42 days. In Q3 this year, the actual journey time stood at 47 days. This is significantly up from the 42 days average in Q2, despite no announced change from carriers.
This increase in actual transit times saw schedule reliability fall to an all-time low for this trade in September, when just 19.5% of ships arrived on time. This is a significant deterioration compared to the start of the year when just over half of ships (53%) arrived on time.
Prior to 2024, schedule reliability on this trade had not fallen below 33%, which highlights the scale of the challenge shippers are facing, especially considering this trade is not directly affected by the major disruption of 2024 – conflict in the Red Sea.
Even the best performing carrier on this metric, ZIM, only achieved a schedule reliability of 30.4% in September. HMM had the lowest schedule reliability with only 10.3% of its ships arriving on time.
Extra capacity helps spot rates soften
Despite deteriorating transit times and reliability, the record high capacity offered between the Far East and South America East Coast has contributed to a softening of the spot market since July.
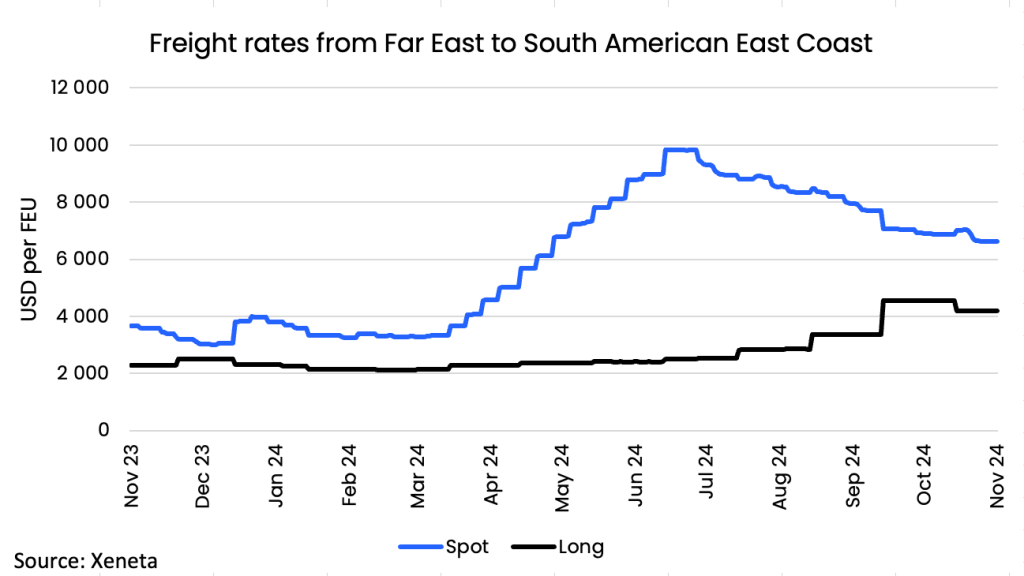
The average spot rate fell to USD 6 610 per FEU on 18 November, down 33.8% from when the market peaked at USD 9 840 per FEU in July. Despite the recent drops, spot rates are still 80.7% higher than they were at this time last year.
The average long-term rate is also substantially up from last year, with an 84.6% increase leaving it at USD 4 200 per FEU. This uptick has only come in the second half of 2024, with November being the first month long-term rates dropped slightly, down a couple of hundred dollars from the end of October.
Many shippers are currently tendering on this trade and the weakening spot market must be balanced against the still significant USD 2 500 per FEU spread between spot and long term rates.

Trade shifts will continue into 2025
Importers and exporters must have transparency through data if they want to manage supply chains in the face of such massive global change. Increasing capacity on a trade may appear to be an obvious benefit for shippers, but if it leads to congestion and delays – especially if larger ships are deployed and port infrastructure is put under strain – then it presents supply chain risk.
With China seemingly looking to increase exports to regions such as South America just as the US is set to increase import tariffs under a new Trump presidency, 2025 will see further shifts in global trade patterns.
Shippers need to be able to take data-driven decisions to keep supply chains moving while also managing freight spend.


