


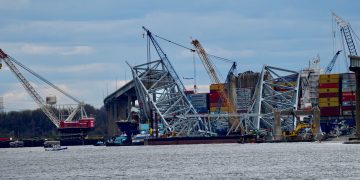


Vessel arrivals and examinations decreased, detentions Increased
The US Coast Guard has published its 2014 Annual Report on Port State Control.The report provides key statistics related to enforcement of international requirements with regard to foreign flag vessels calling in US ports.
Vessel Arrivals, Examinations, Detentions Increased
In 2014:
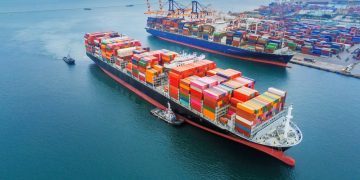
- a total of 9,227 individual vessels, from 83 different Flag Administrations, made 79,091 port calls to the United States.
- The Coast Guard conducted 9,232 SOLAS safety exams and 8,562 ISPS exams on these vessels.
- The total number of ships detained in 2014 for environmental protection and safety related deficiencies increased from 121 to 143.
- The total number of ships detained in 2014 for security related deficiencies increased slightly from 8 to 10.
Flag Administration Safety Performance
Flag Administration safety performance for 2014 decreased from the previous year, with the overall annual detention rate increasing from 1.29% to 1.55%. In addition, the three-year rolling detention ratio increased slightly from 1.11% to 1.31%. The Flag Administrations of New Zealand, Peru, and the Philippines were all removed from USCG’s Targeted Flag List.
USCG also notes that vessels from the Flag Administrations of Curacao, Anguilla, Kiribati, and Malaysia are potentially qualified for USCG’s QUALSHIP 21 Program and their vessels will be entered into the program, contingent upon the Administration and the vessels meeting other required criteria.

| District | Visits |
Safety Examinations |
Safety Detentions |
Security Examinations |
Security Control Actions |
| 1st |
7.272 |
893 | 3 | 881 | 0 |
| 5th | 7.269 | 973 | 31 | 972 | 1 |
| 7th | 22.545 | 1.634 | 40 | 1.328 | 1 |
| 8th | 24.652 | 3.263 | 48 | 3.059 | 4 |
| 9th | 2.330 | 178 | 0 | 211 | 0 |
| 11th | 8.113 | 1.020 | 12 | 960 | 2 |
| 13th | 3.881 | 891 | 4 | 877 | 2 |
| 14th | 1.452 | 272 | 5 | 192 | 0 |
| 17th | 1.577 | 108 | 0 | 82 | 0 |
| TOTAL | 79.091 | 9.232 | 143 | 8.562 | 10 |
Flag Administration Security Performance
Flag Administration security performance for 2014 slightly decreased from the previous year, with the Coast Guard annual Control Action Ratio (CAR) increasing from 0.09% to 0.12%. However, the threeyear rolling average CAR has dropped from 0.12% to 0.10%, representing the lowest three-year security detention ratio USCG has ever recorded.
Additionally, the Flag Administrations of Turkey and Saint Vincent and The Grenadines were removed from USCG’s targeted matrix. Due to the overall excellent Flag Administration security compliance performance, USCG will maintain the targeting point level for the Flag Administration Control Action Ratio at 1.50%.
Leading detentions
In 2014 the top three areas for detainable deficiencies remain the same from last year with ISM, MARPOL Annex I, and Fire Fighting Appliance deficiencies leading the way.
- In most cases with ISM, it was clear that the master and crew were either not familiar with ISM requirements or failed altogether to properly conduct required maintenance of the ships equipment in accordance with the procedures in their system.
- On MARPOL deficiencies, USCG continued to find crews intentionally disabling required pollution prevention equipment (such as bypassing oily water separators), failing to conduct proper maintenance, or were not knowledgeable in proper equipment operation.
- A large number of fire fighting -related detentions were still attributed to Fixed Water-Based Fire Fighting Systems and Quick-Closing Valves that had been disabled. Others items included fire pumps, along with emergency fire pumps, that were either inoperative or operated with insufficient pressure.
Type of Safety Deficiencies

Detentions by Ship Type

Targeting and QUALSHIP 21 standards
Last year, USCG introduced a proposal to lower the flag state eligibility for the program to 0.8% by 2018. Based on the comments received, USCG has decided to retain the QUALSHIP 21 eligibility at a detention ratio of 1.0% or less for the near future.
In addition, USCG is now calculating QUALSHIP 21 eligibility based on the number of detentions divided by the number of PSC exams over the past three years. In the past, USCG used the number of distinct vessel arrivals but have made this change to keep its detention ratio method in line with those employed by the Paris and Tokyo MOUs.
Please click below to read USCG Annual Report on Port State Control for 2014: