


UNCTAD published its Handbook of Statistics for 2018, reporting that the value of world merchandise imports were $17.7 trillion. Namely, merchandise trade grew by 10.4%, while the share of South-South trade in global trade amounted for 28%.
World merchandise trade
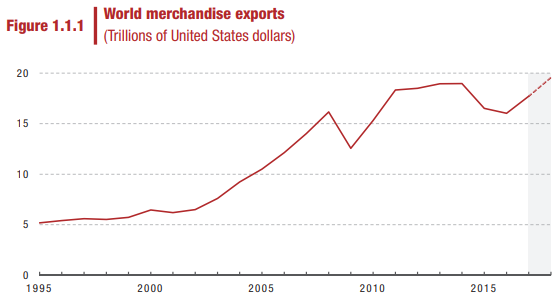
In 2017, world merchandise trade established a substantial growth, after two years of decline. In fact, exports amounted to US$17.7 trillion, increasing by 10% from 2016. In 2018, exports are nowcast to reach a record high of US$19.6 trillion.
[smlsubform prepend=”GET THE SAFETY4SEA IN YOUR INBOX!” showname=false emailtxt=”” emailholder=”Enter your email address” showsubmit=true submittxt=”Submit” jsthanks=false thankyou=”Thank you for subscribing to our mailing list”]
What is more, the majority of economies in the world contributed to the increase in international merchandise trade, except for Switzerland-Liechtenstein, Luxembourg, Jordan, the Democratic People’s Republic of Korea and some African and small-island economies.
Strong increases were recorded for 2017 in the Republic of Korea with 15.8% and the Netherlands with 14.1%. Specifically, the world’s top-four exporters are:
- China;
- United States of America;
- Germany;
- Japan.
Maritime transport
International seaborne trade also gathered momentum in 2017, with volumes increasing by 4%. This was the fastest growth in the last five years.
Namely, in 2017 10.7 billion tons of goods were loaded globally. This amount is 1.5 billion tons more than in 2012. Loading of dry cargo alone increased by 1.2 billion tons, while crude oil, petroleum products and gas contributed the rest 305 million tons to the overall increase.
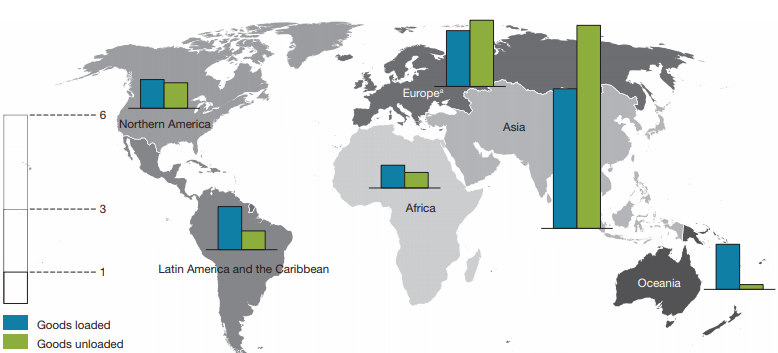
Asia was by far the largest trading region. Specifically, in 2017, 4.4 billion tons of goods were loaded, and 6.5 billion tons unloaded, in Asian seaports. The other continents registered less than half of these amounts. The volumes of goods delivered to ports in Oceania were particularly small.
Developing economies once again were key to the growth of global seaborne trade. Specifically, they account for almost two thirds of goods loaded and unloaded worldwide. In fact, their share in seaborne trade imports has steadily increased over the last ten years, reaching 63% in 2017. Developing countries in Asia mainly drove this increase, as in these economies, as well as in Oceania’s economies, around one quarter more goods were unloaded in 2017 than in 2012.
Main players
In January 2018, the world fleet reached a carrying capacity of 1.9 billion deadweight tons (dwt), 62 million dwt more than last year. Over recent years, tonnage has expanded considerably in all segments, with the exception of general cargo carriers.
The top five ship owning economies together amount for 50% of world fleet tonnage and they are:
- Greece, which has expanded its lead, adding 21 million dwt in 2017 to reach a market share of 17%;
- Japan;
- China;
- Germany;
- Republic of Korea.
As for the flags, the three leading flags of registration are of economies that are not major shipowners, such as Panama, the Marshall Islands and Liberia. Additionally, Hong Kong SAR and Singapore come in fourth and fifth place respectively.
Currently, more than 90% of shipbuilding in 2017 took place in China, the Republic of Korea and Japan. About 80% of ship demolition occurred in South Asia.
Major flags
As for the flags of registration, most commercial ships are carrying a different flag from the flag of the economy of ownership. Registrations in developing economies are common, accounting for 76% of global registrations in terms of tonnage.
Among the top five registries we find:
- Panama, which has not recorded any further increase for the last four years;
- Liberia;
- Marshall Islands, which has recorded the strongest increase in registrations over recent years.
- Hong Kong SAR;
- Singapore.

See more information in the Handbook of Statistics for 2018