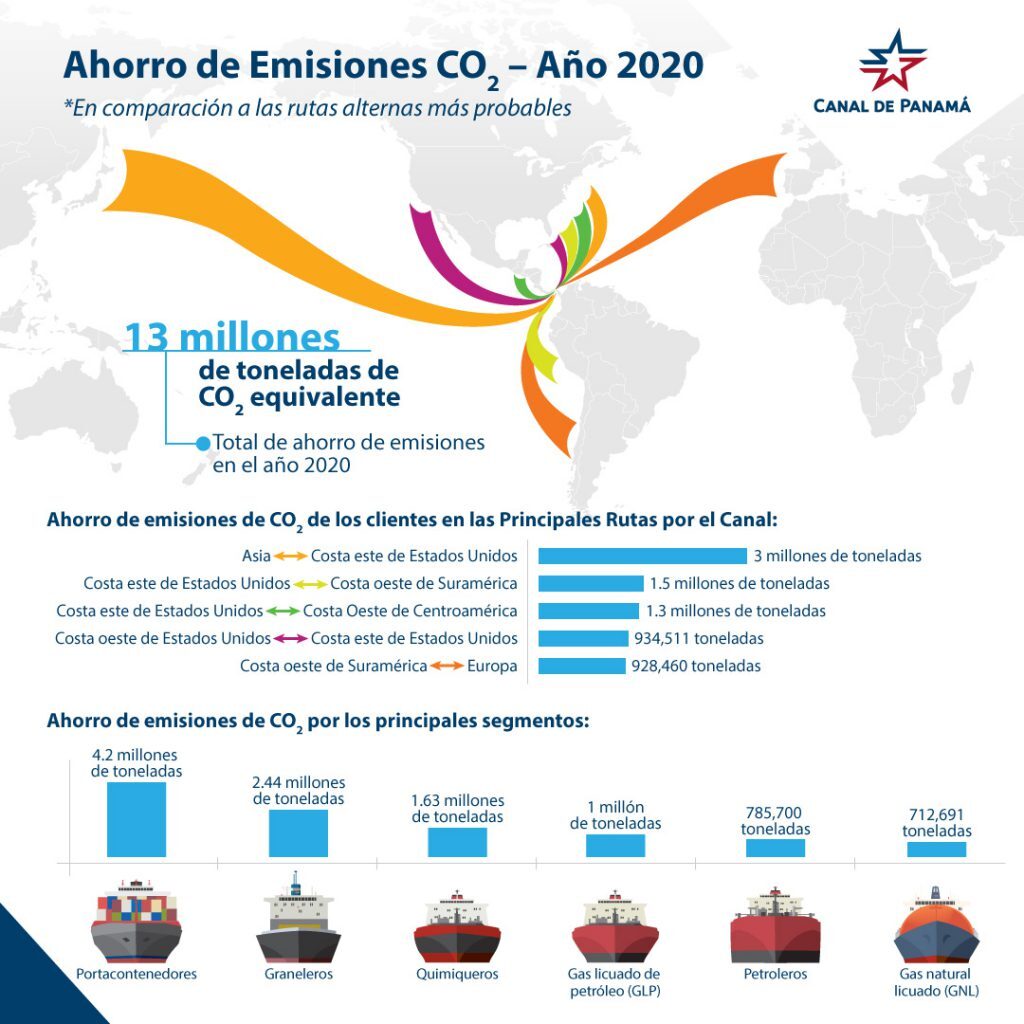
By offering a shorter route for ships, the Panama Canal managed to contribute to the reduction of more than 13 million tons of CO2 emissions in 2020, in comparison to alternative routes.
These savings are equal to the greenhouse gas (GHG) emissions of 2.8 million sedans driven for one year or the carbon absorbed by 217 million tree seedlings grown for 10 years.
In addition, the Panama Canal announced the launch of the CO2 Emissions Reduction Dashboard, through which it will publish monthly data on CO2 emissions saved by ships that chose to transit the interoceanic route.
The dashboard has the total data for the year 2020, but will begin reporting the monthly figures from February.
Our goal is to help customers create more sustainable supply chains. By publishing this data every month, we seek to be more transparent about how the Panama route helps shipping companies reduce emissions with each transit and track our own growth as a green route for global maritime trade
highlighted Panama Canal Administrator Ricaurte Vásquez Morales.

The data is compiled by the Interoceanic Highway Emissions Calculator, which enables customers to measure their reductions in greenhouse gas emissions by route, including the amount saved by transit through the Panama Canal, over others.
Using georeferenced data and technology already on board ships, the Emissions Calculator takes into consideration several factors such as ship type, speed, route, ship size, capacity, type and fuel consumption, in order to provide the most accurate measurements.
This announcement reaffirms the commitments of the Panama Canal to global efforts to reduce emissions, including the IMO’s initial GHG strategy, IMO 2020 and the United Nations (UN) Sustainable Development Goal 13 (SDG).


