


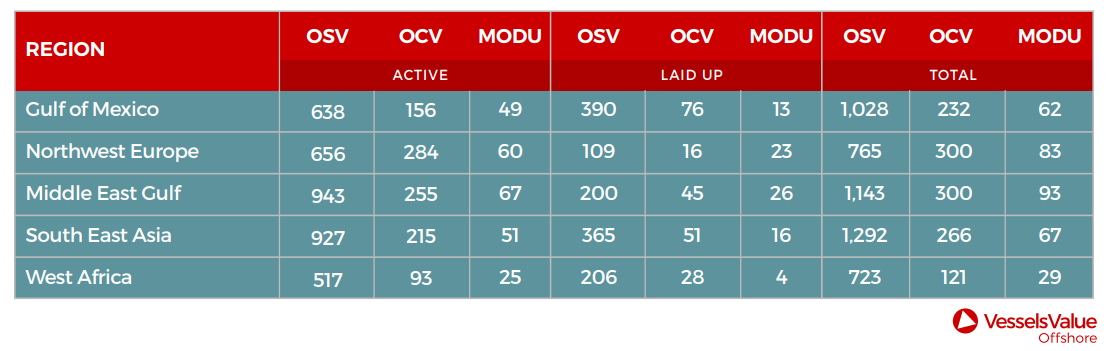
Robert Day, VesselsValue Head of Offshore, discusses and presents the first edition of Offshore Layups infographics. As presented, out of all the major offshore oil and gas regions, the U.S. Gulf of Mexico has the largest number of laid-up OSVs.
So, how do we define ‘layups’? The study suggests that
We observe the recency of a vessel’s AIS signal and filter the data appropriately. Vessels that have not signalled for over 8 weeks are considered in layup.
Mainly, VesselsValue states that an OSV is in layup when it has not broadcast AIS activity in eight weeks.
Therefore, 390 OSVs, 76 offshore construction vessels and 13 MODUs are laid up in the Gulf of Mexico, representing a continued low level of offshore drilling activity in the area.
The OSV layups constitute 38% of the total supply.
Moreover, Robert Day addresses that when observing the figures above, it’s obvious that the market with the highest layup is the US Gulf.
The US Gulf is still experiencing challenges and barriers in the OSV and OCV area.
On the contrary, Northwest Europe marks a layup at 14% for OSV’s.
We have recently witnessed several Northsea owners reactivate vessels due to increased sentiment and opportunity in the region. Interestingly the Middle East Gulf comes in just behind Northwest Europe. South East Asia and West Africa remain are in a similar state.
… Robert Day comments.
Concluding, VesselsValue informs that Robert Day discusses the first of our global Offshore layups infographics and will be published once a quarter.