


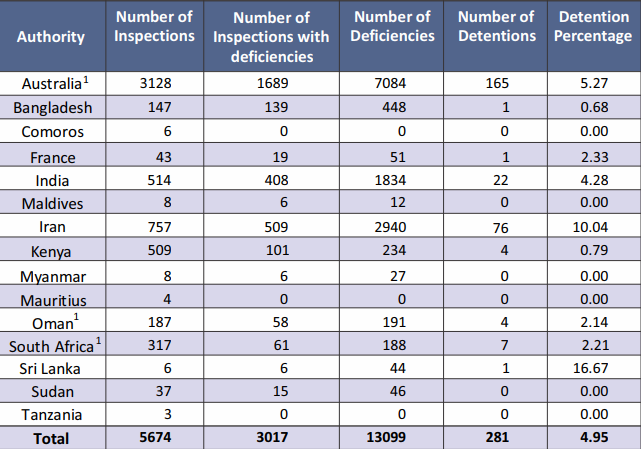
During 2017, there were a total of 5674 inspections in the Indian MoU region. Out of these 5674 inspections, 3017 inspections had deficiencies and the total numbers of deficiencies were 13099. Serious deficiencies led to the detention of 281 ships and needed to be rectified prior to the ships departure, while the overall detention percentage for the year was 4.95 %.
As the Indian MoU notes:
- There was decrease in total number of inspections in 2017, compared with those in 2016, and the detention percentage decreased from 6.16% recorded in 2016.
- The average number of deficiencies per inspection in 2017 (2.30) has slightly decreased compared to the previous year (2.46).
[smlsubform prepend=”GET THE SAFETY4SEA IN YOUR INBOX!” showname=false emailtxt=”” emailholder=”Enter your email address” showsubmit=true submittxt=”Submit” jsthanks=false thankyou=”Thank you for subscribing to our mailing list”]
Detentions
- In 2017, the most inspections and the most detentions were noted on bulk carriers, as a total of 2688 were made, with 131 being made.
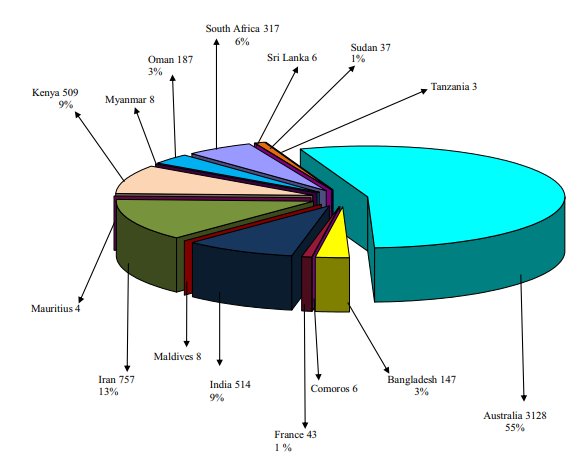
- The most inspection were made in Australia, with 3128 representing 55% of the inspections.
- From a total of 74 flags, the most inspections regarded the Panama flag with 1311 inspections, and so did the number of detentions with 91.
- The most common deficiency was “Safety of Navigation”. 2013 such deficiencies were reported, a percentage of 15.37.
Deficiencies
- Tugboats presented the most deficiencies;
- Panama had the most deficiencies reported;
- The most deficiencies regarded Safety of Navigation, followed by Fire Safety and Life saving appliances.

See more information in the following PDF