


The US Coast Guard, in partnership with the American Waterways Operators (AWO), released the National Quality Steering Committee’s annual safety report, containing freight carrying towing industry data and measures for 1994-2016.
To track overall trends in towing vessel safety and environmental protection, the National Quality Steering Committee looks at three safety measures: Crew fatalities per 100,000 towing industry workers, gallons of oil spilled from tank barges per million gallons transported, and the number of towing vessel marine casualties (overall or by incident severity).
Crew fatalities
- There were eight operational towing vessel crew fatalities in 2016.
- While fifteen deaths aboard towing industry vessels in 2016 were reported to the USCG, only eight were directly related to towing vessel operations. The other seven deaths were due to existing medical conditions (5) and accidental overdose (2).
- Of the eight crew fatalities, one casualty accounted for three deaths.
Oil spill volume and rate
- According to Coast Guard records, 32,202 gallons of oil was spilled as a result of 64 operational tank barge pollution incidents in 2016.
- The three largest spills accounted for 97% of the total volume of oil spilled from tank barges in 2016.
- The projected oil spill rate for 2016 is approximately one gallon of oil spilled per 2,160,000 gallons transported or 0.42 of a gallon spilled per million gallons of oil transported.
- Overall, the oil spill rate continues to be relatively low considering the volumes transported, and the fact that oil transportation volumes by barge have steadily increased by 22% over the last 5 years.
Severity of vessel incidents
- There were 1,231 towing vessel incidents, of which 84% were classified as low severity incidents in 2016.
- Medium and high severity incidents represented 10% and 6% respectively.
- There was a 12.8% increase in investigated incidents from 2015 to 2016. The number of medium and high severity incidents remains fairly consistent over the years.
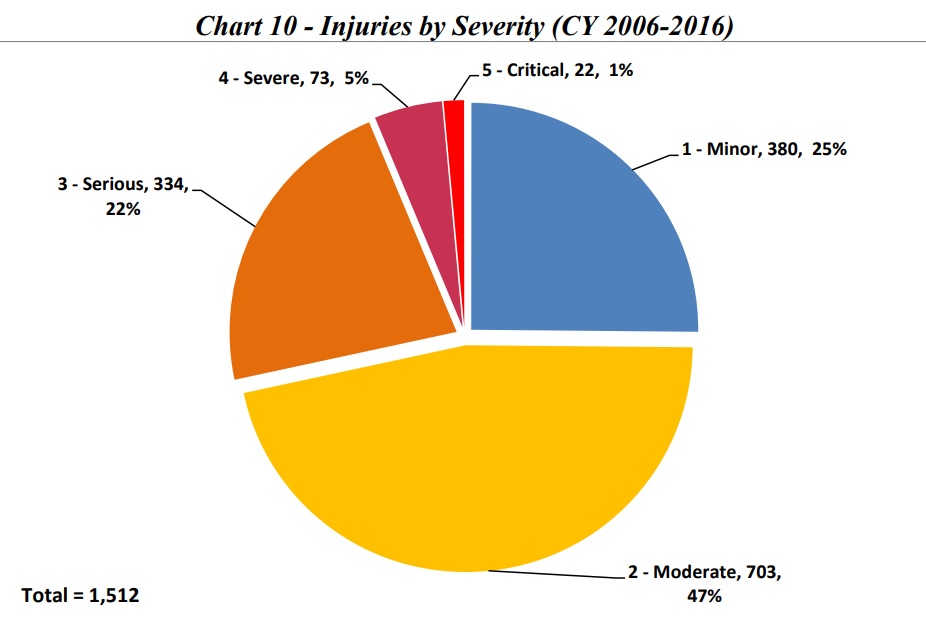
The report also includes summary statistics on crew member injuries, which the National Quality Steering Committee began tracking in 2006, for calendar years 2006 to 2016.
Crew member injuries
- In 2016, there were 100 injuries involving 98 incidents, down from 109 injuries in 2015.
- In 2016, there were no injuries that met the critical severity threshold. Also, between 2015-2016 there was a small decrease (-1.8%) in the “most significant” category, combining serious, severe and critical in nature.
Accident types most associated with injuries in the most significant category in frequency order are:
- Fall onto surface,
- Line handling/caught in lines,
- Crushed between objects, and
- Struck by moving object.
Explore more by reading the full report: